
AskSia

Question
Math
Posted about 2 years ago
A sociologist studying marriage in the United States and Canada wanted to compare how old, on average, women in each country are when they first get married. The sociologist obtained a random sample of married women from each country. Here is a summary of the ages at first marriage for the women in each sample:
\begin{tabular}{lrr}
Age at first marriage & US & Canada \\
\hline Mean & 25.5 & 26.4 \\
Standard deviation & 4.0 & 3.5 \\
Number of women & 108 & 102
\end{tabular}
The researcher wants to use these results to test versus . Assume that all conditions have been met.
What is the -value associated with these sample results?
Choose 1 answer:
(A) -value
(B) -value
(C) -value
(D) -value
(E) -value 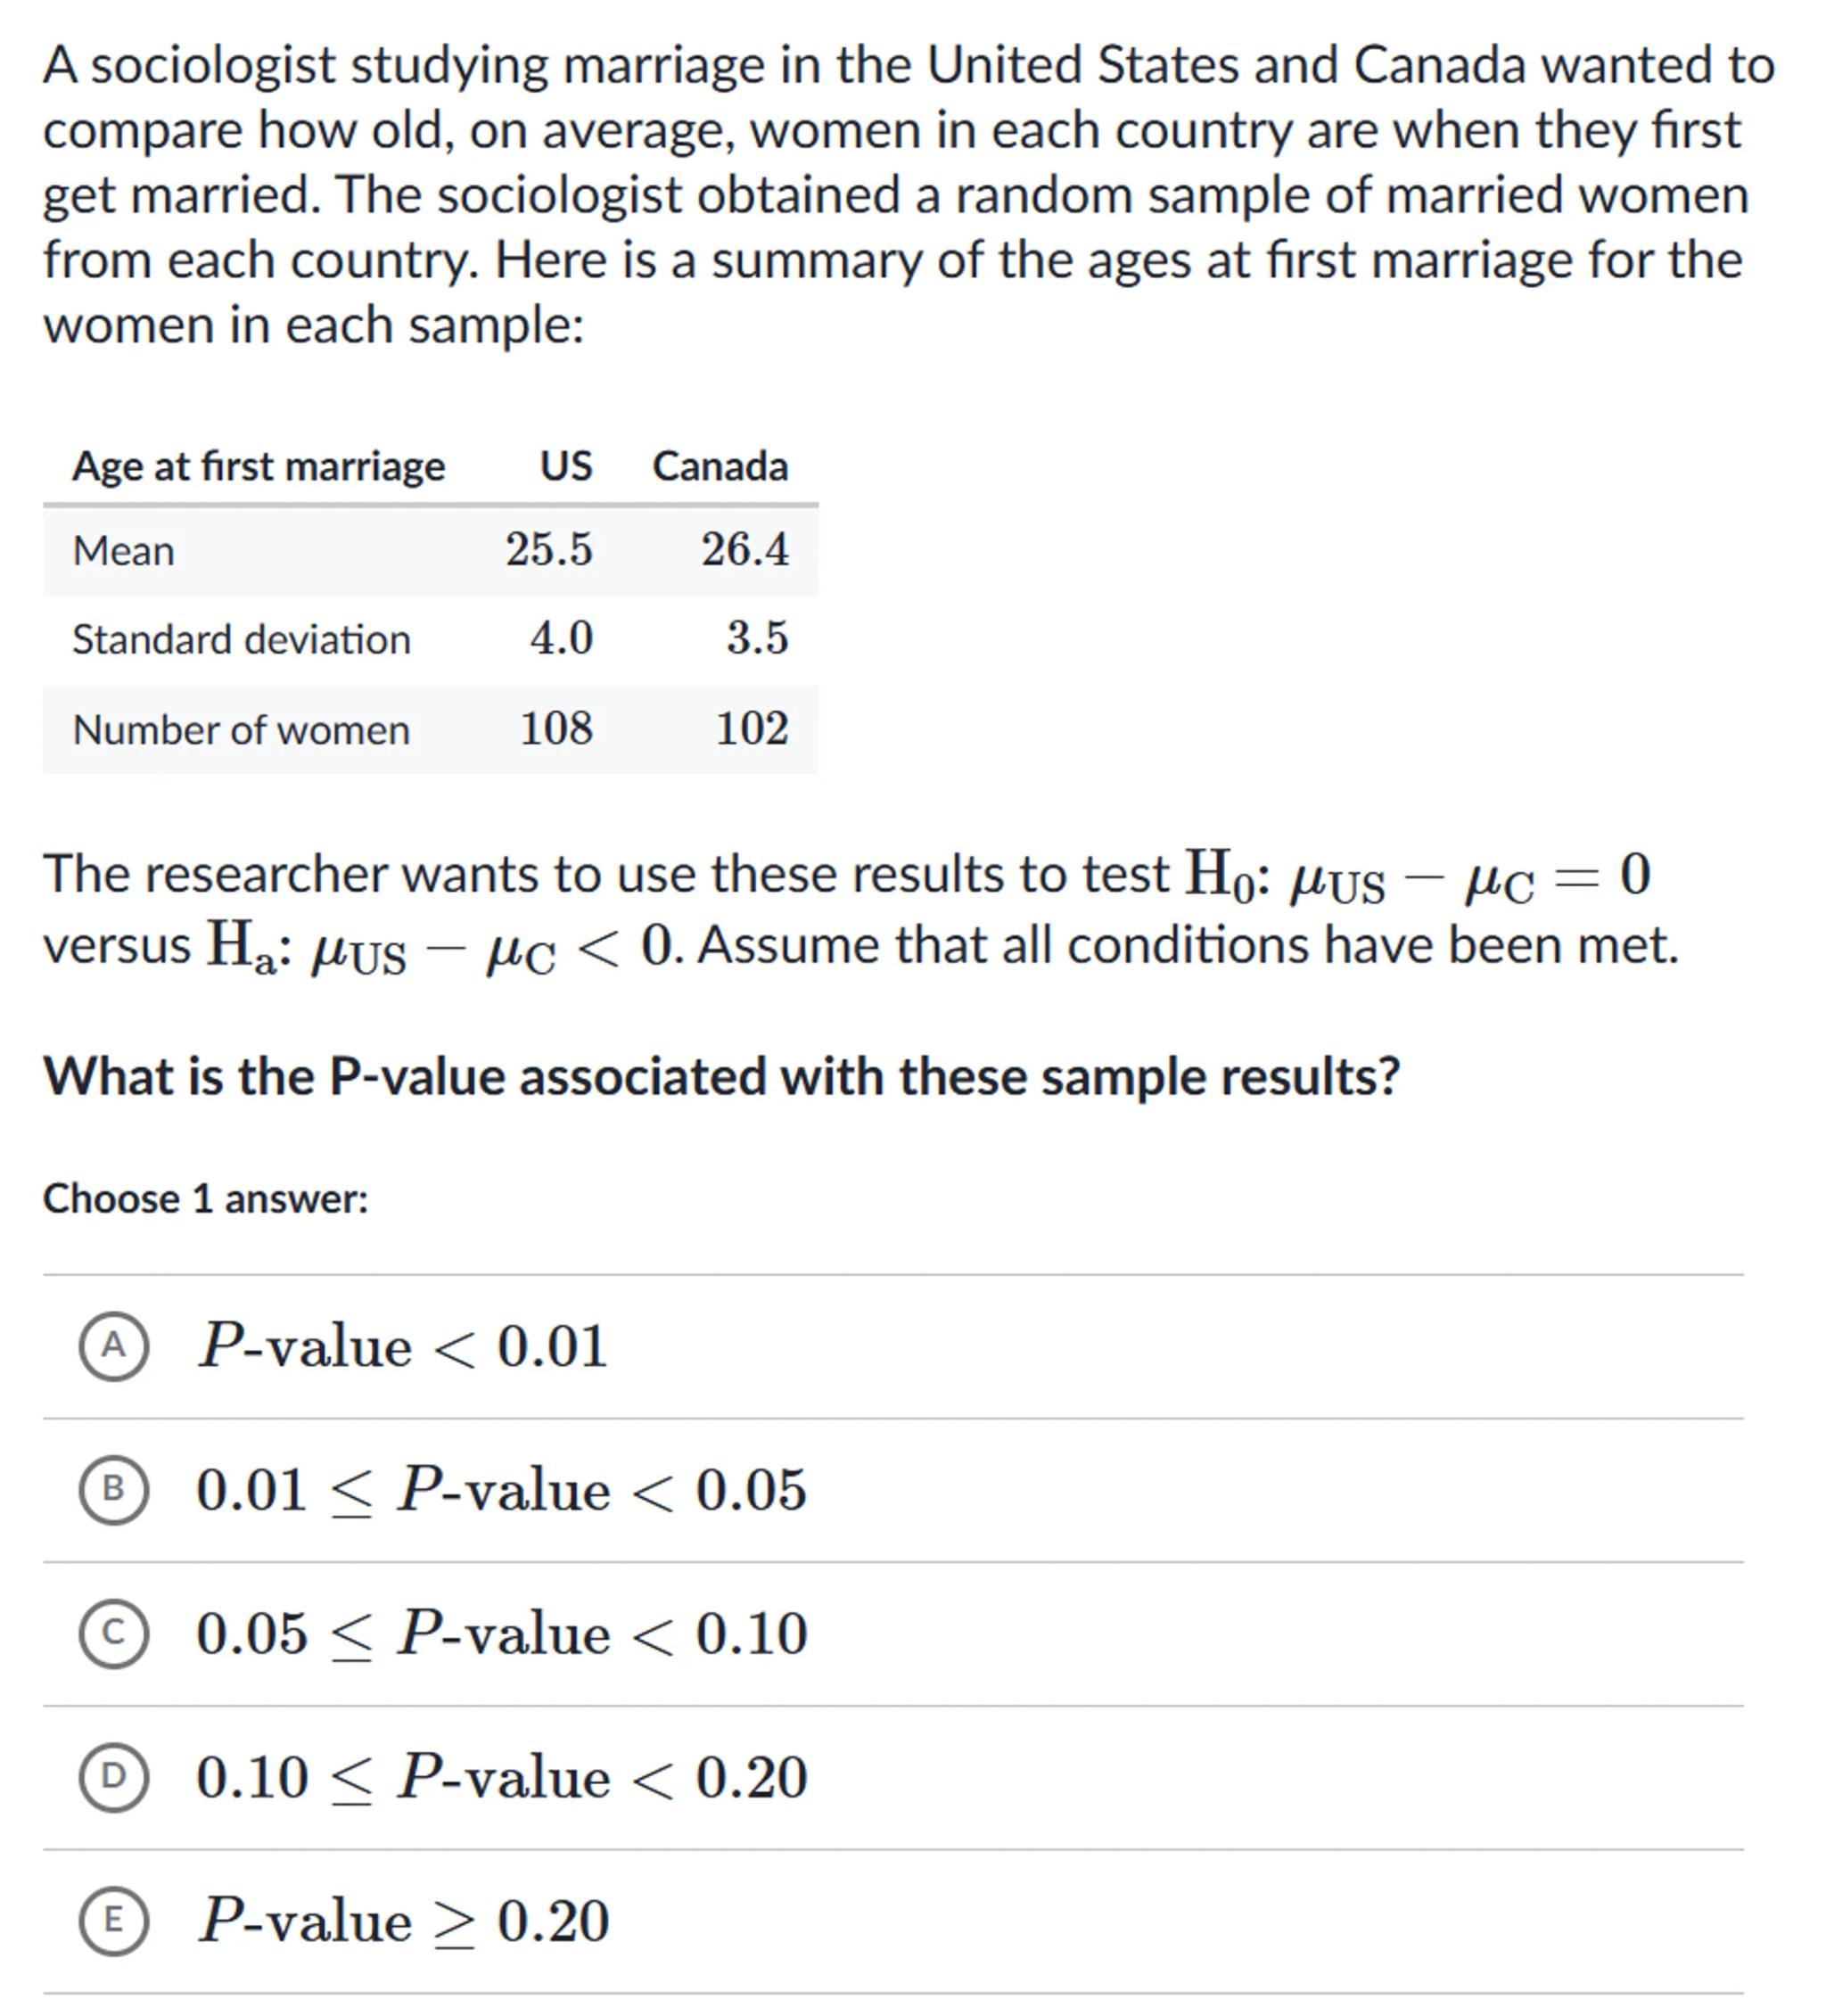
 Sign in to unlock the answer
Answer from Sia
Posted about 2 years ago
Solution by Steps
step 1
Calculate the standard error of the difference in sample means
step 2
The standard error (SE) is calculated using the formula , where and are the standard deviations for the US and Canada, and and are the sample sizes for the US and Canada, respectively
step 3
Plug in the values:
step 4
Calculate the test statistic (t-value) using the formula , where and are the sample means for the US and Canada, and is the hypothesized difference in population means under the null hypothesis
step 5
Since the null hypothesis states that , the formula simplifies to
step 6
Plug in the values:
step 7
Use the calculated t-value to find the P-value from the t-distribution with degrees of freedom approximately equal to the smaller of and
step 8
Since the alternative hypothesis is , we are looking for the area to the left of the calculated t-value in the t-distribution
step 9
Determine the range in which the P-value falls based on the t-distribution table or a statistical software
Answer
The P-value associated with these sample results falls within one of the given ranges (A, B, C, D, or E).
Key Concept
Hypothesis testing and P-value determination
Explanation
The P-value in a hypothesis test measures the probability of obtaining a test statistic as extreme as the one observed, under the assumption that the null hypothesis is true. It helps us decide whether to reject the null hypothesis. In this case, we are looking for the probability that the difference in means is less than zero, given the observed sample data.
Not the question you are looking for? Ask here!
Enter question by text
Enter question by image

Unlock Smarter Learning with AskSia Super!
Join Super, our all-in-one AI solution that can greatly improve your learning efficiency.
30% higher accuracy than GPT-4o
Entire learning journey support
The most student-friendly features

Study Other Question