Sia

Question
Math
Posted almost 2 years ago
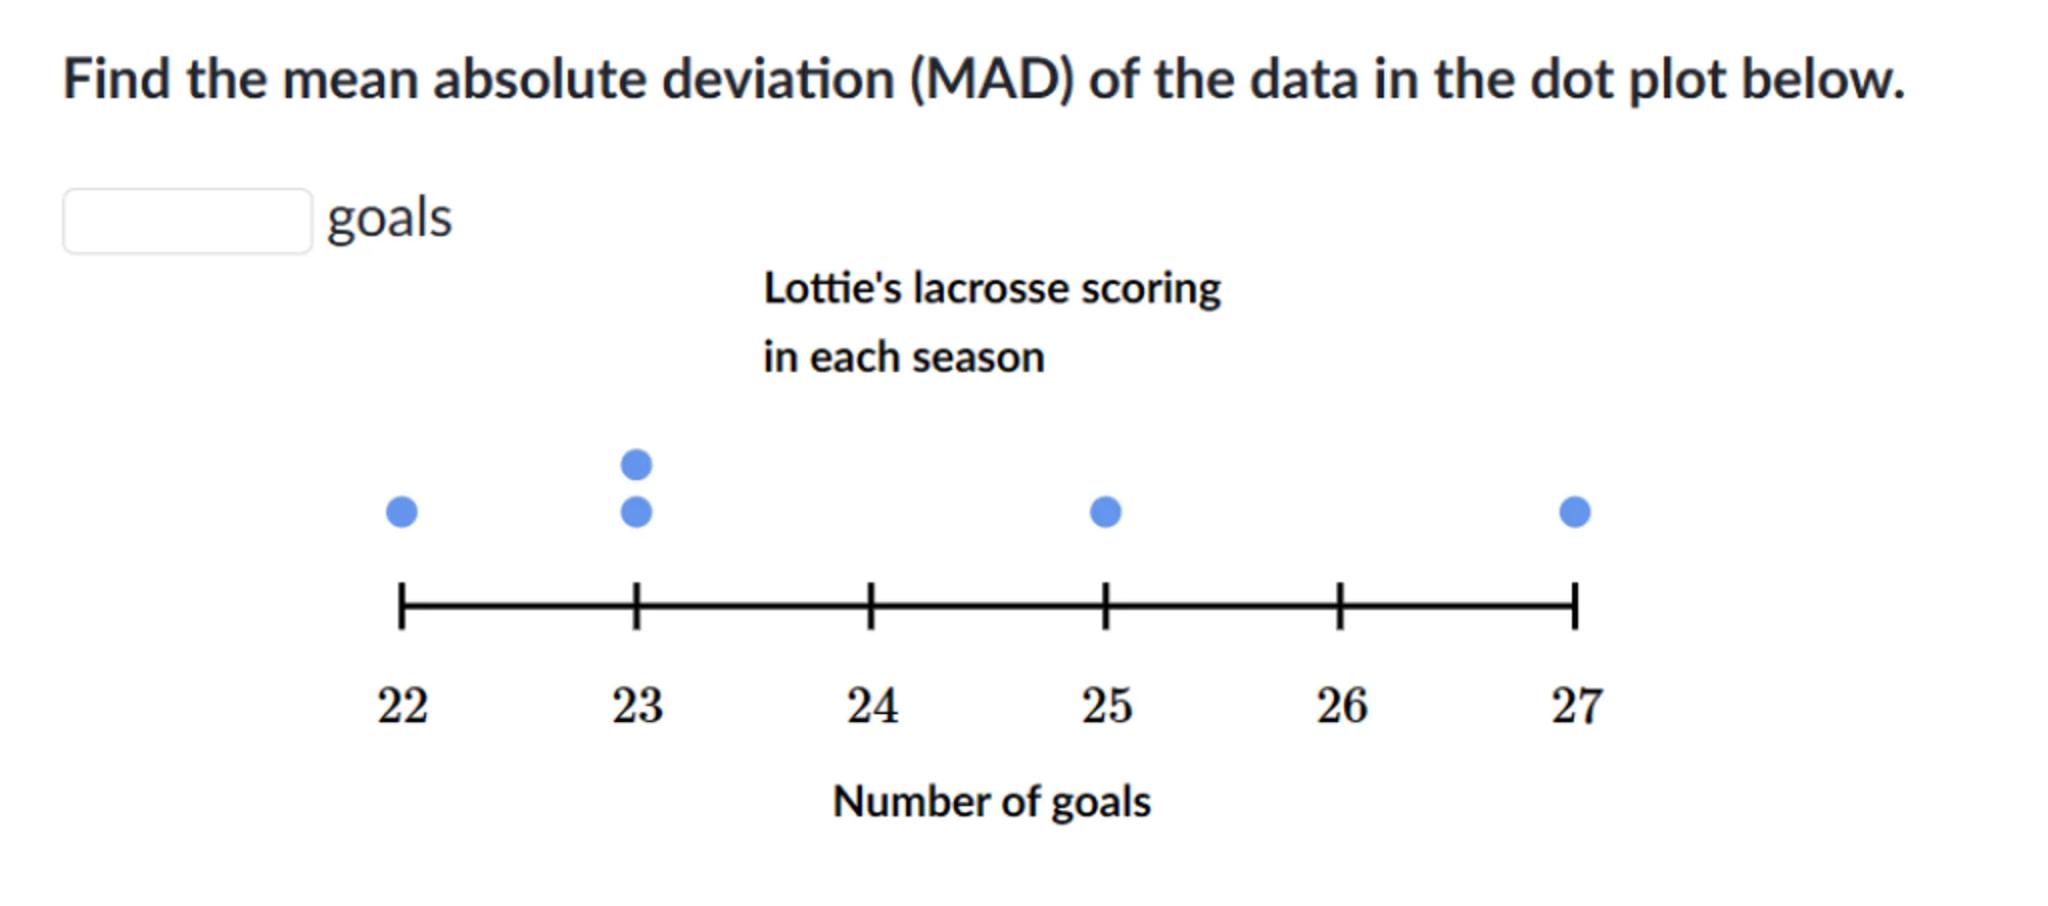
Find the mean absolute deviation (MAD) of the data in the dot plot below.
goals

Answer from Sia
Posted almost 2 years ago
Solution by Steps
step 1
Calculate the mean of the data set {22, 23, 23, 25, 27}
step 2
The mean (average) is the sum of the data points divided by the number of data points:
step 3
Calculate the absolute deviations from the mean for each data point:
step 4
The absolute deviations are:
step 5
Calculate the mean absolute deviation (MAD) by finding the mean of these absolute deviations:
Answer
The mean absolute deviation (MAD) of the data is 1.6.
Key Concept
Mean Absolute Deviation (MAD)
Explanation
MAD is the average of the absolute deviations from the mean of a data set. It measures the spread of the data points.
Not the question you are looking for? Ask here!
Enter question by text
Enter question by image
Unlock Smarter Learning with AskSia Super!
Join Super, our all-in-one AI solution that can greatly improve your learning efficiency.
30% higher accuracy than GPT-4o
Entire learning journey support
The most student-friendly features
Study Other Question