Sia

Question
Math
Posted almost 2 years ago
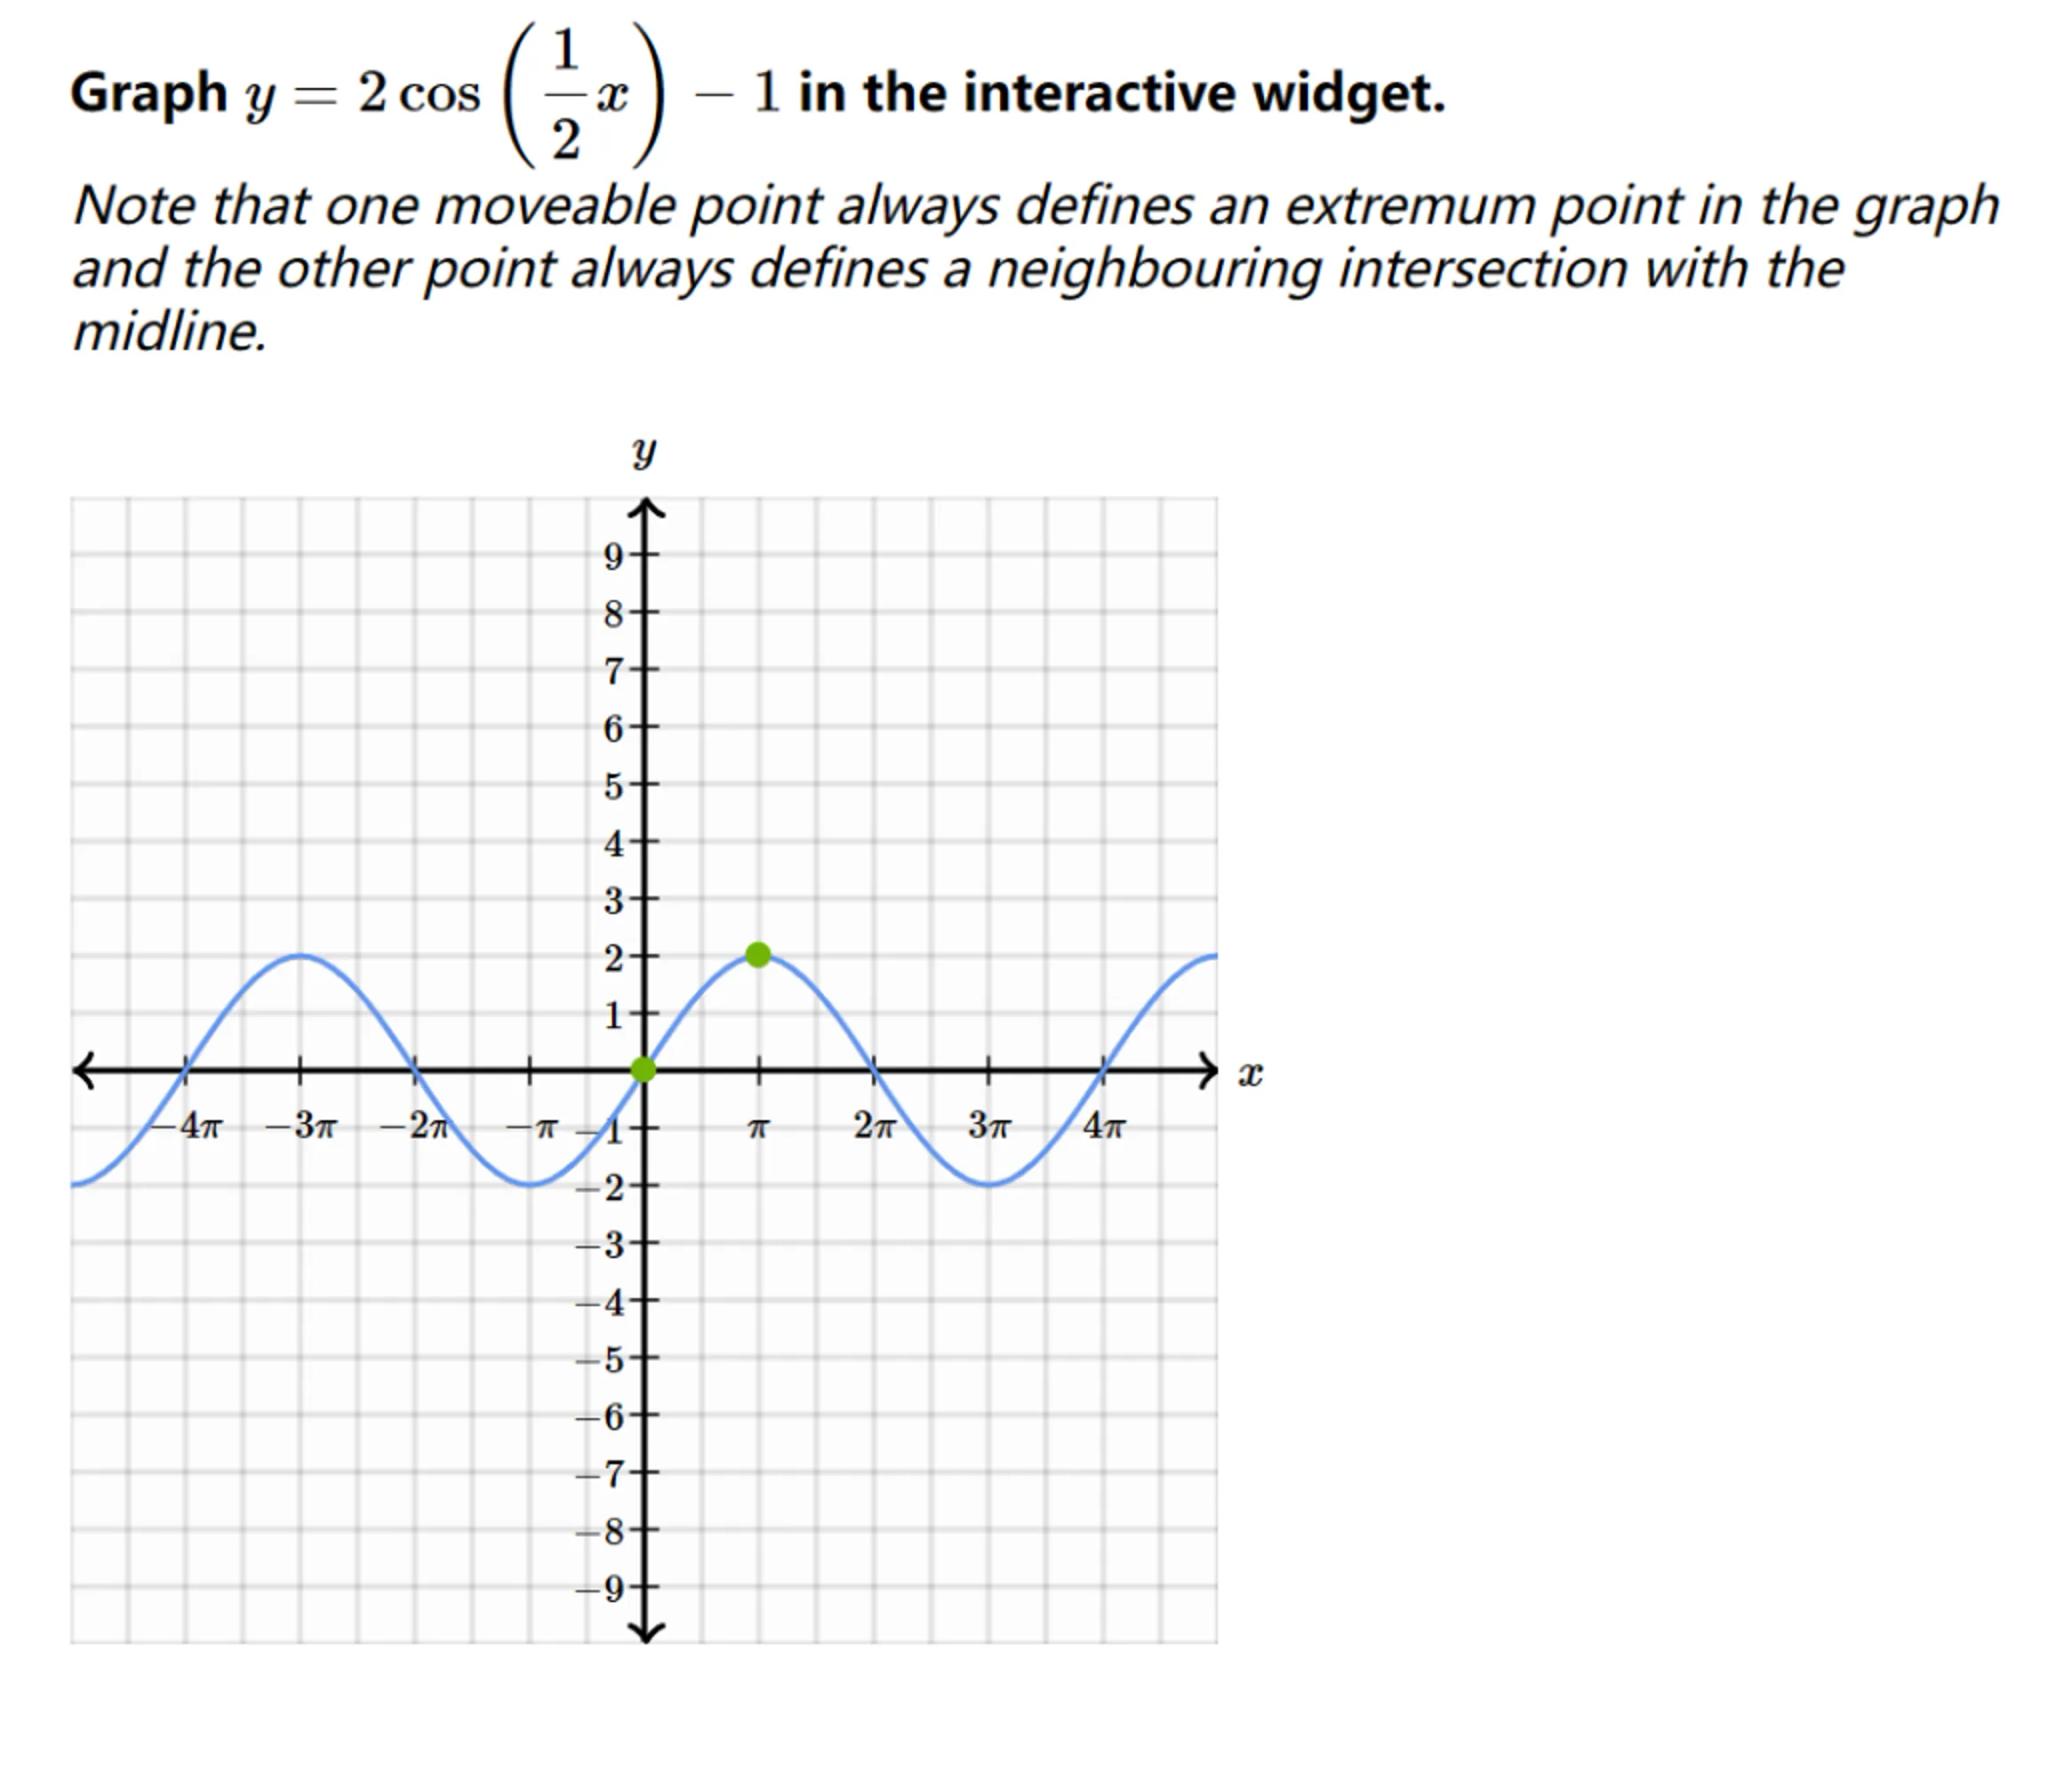
Graph in the interactive widget.
Note that one moveable point always defines an extremum point in the graph and the other point always defines a neighbouring intersection with the midline.

Answer from Sia
Posted almost 2 years ago
Solution by Steps
step 1
To graph the function , we need to consider the amplitude, frequency, phase shift, and vertical shift
step 2
The amplitude is 2, which means the graph oscillates 2 units above and below the midline
step 3
The frequency is determined by the coefficient of inside the cosine function, which results in a period of
step 4
There is no phase shift as there is no horizontal translation inside the cosine function
step 5
The vertical shift is -1, which means the midline of the graph is at
step 6
The graph oscillates between and , and has a period of
step 7
The green point at indicates the maximum value of the function within one period
Answer
The graph of oscillates between and , with a period of , and has a vertical shift down by 1 unit.
Key Concept
Graphing Trigonometric Functions
Explanation
To graph a trigonometric function like a cosine function, it's important to identify the amplitude, period, phase shift, and vertical shift. These determine the shape and position of the graph on the coordinate plane.
Not the question you are looking for? Ask here!
Enter question by text
Enter question by image
Unlock Smarter Learning with AskSia Super!
Join Super, our all-in-one AI solution that can greatly improve your learning efficiency.
30% higher accuracy than GPT-4o
Entire learning journey support
The most student-friendly features
Study Other Question