Sia

Question
Statistics
Posted over 1 year ago
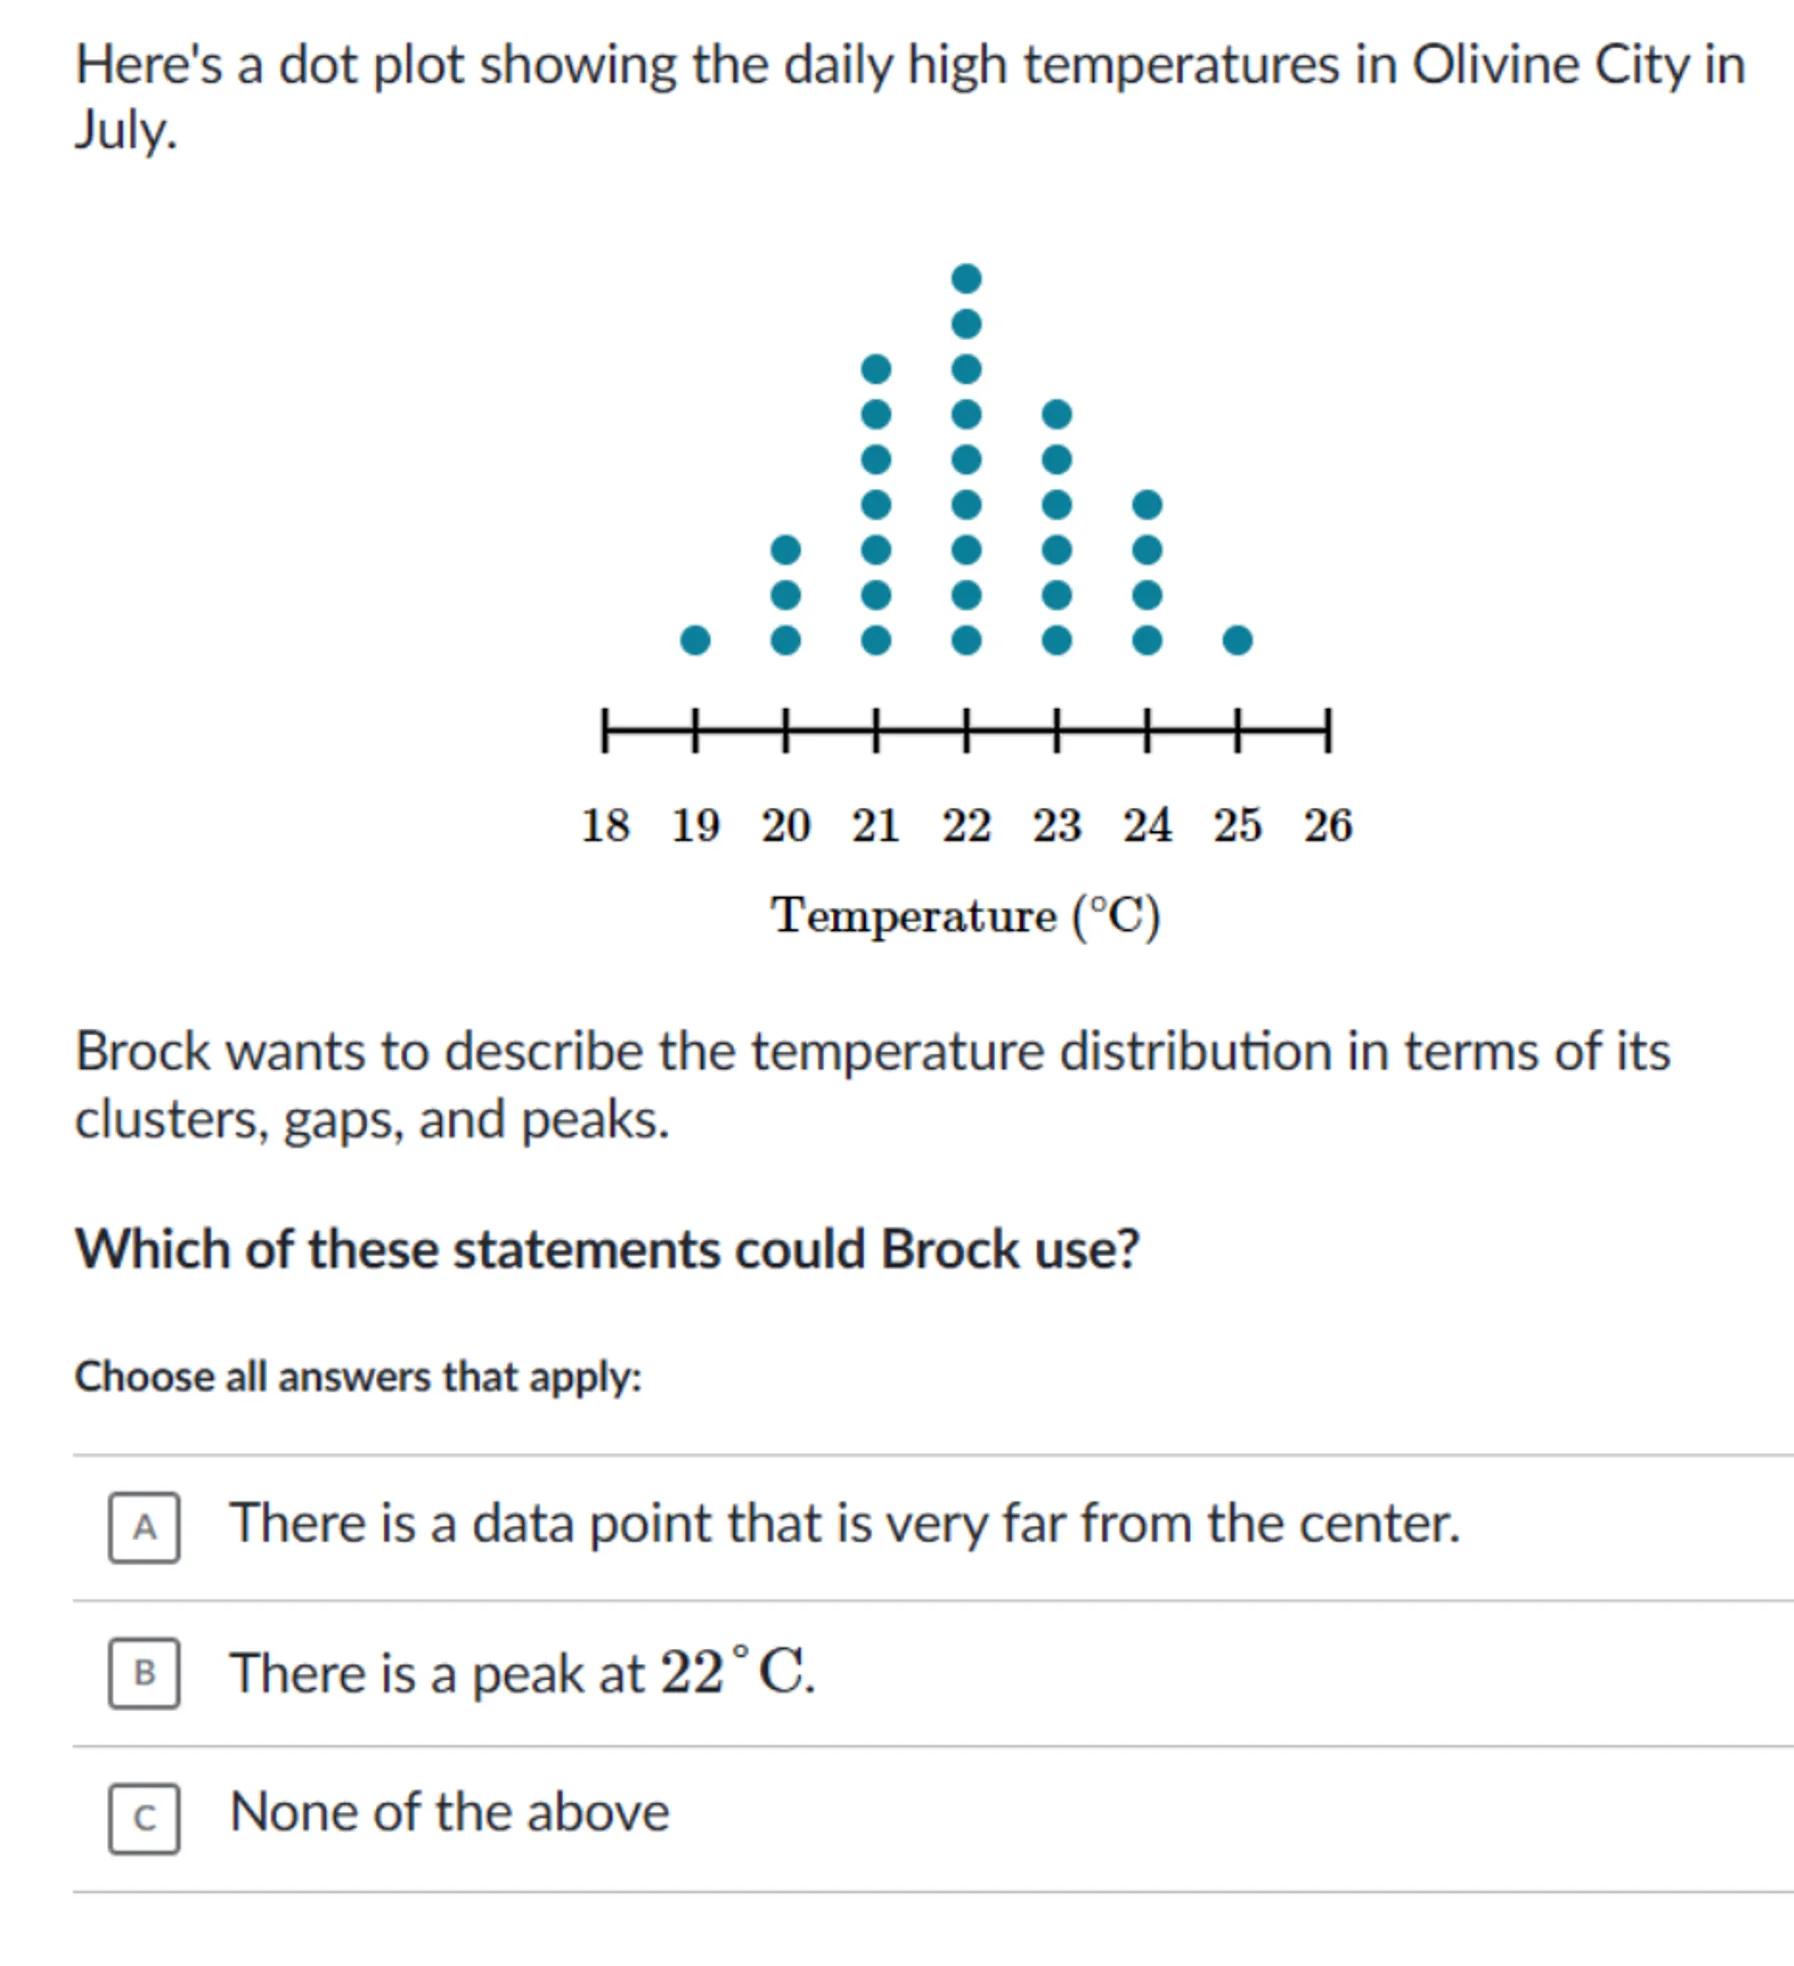
Here's a dot plot showing the daily high temperatures in Olivine City in July.
Brock wants to describe the temperature distribution in terms of its clusters, gaps, and peaks.
Which of these statements could Brock use?
Choose all answers that apply:
A There is a data point that is very far from the center.
B There is a peak at .
c. None of the above

Answer from Sia
Posted over 1 year ago
Solution by Steps
step 1
Identify the clusters, gaps, and peaks in the dot plot. The dot plot shows the following distribution: one dot at 19°C, two dots at 20°C, four dots at 21°C, seven dots at 22°C, six dots at 23°C, four dots at 24°C, and one dot at 25°C
step 2
Determine if there is a data point very far from the center. The data points range from 19°C to 25°C, with the center around 22°C. There are no data points that are very far from this center
step 3
Identify the peak in the distribution. The highest frequency of data points is at 22°C, with seven dots
Answer
B
Key Concept
Peak in a distribution
Explanation
A peak in a distribution is the value with the highest frequency. In this case, 22°C has the highest number of data points, making it the peak.
Not the question you are looking for? Ask here!
Enter question by text
Enter question by image
Unlock Smarter Learning with AskSia Super!
Join Super, our all-in-one AI solution that can greatly improve your learning efficiency.
30% higher accuracy than GPT-4o
Entire learning journey support
The most student-friendly features
Study Other Question