Sia

Question
Statistics
Posted over 1 year ago
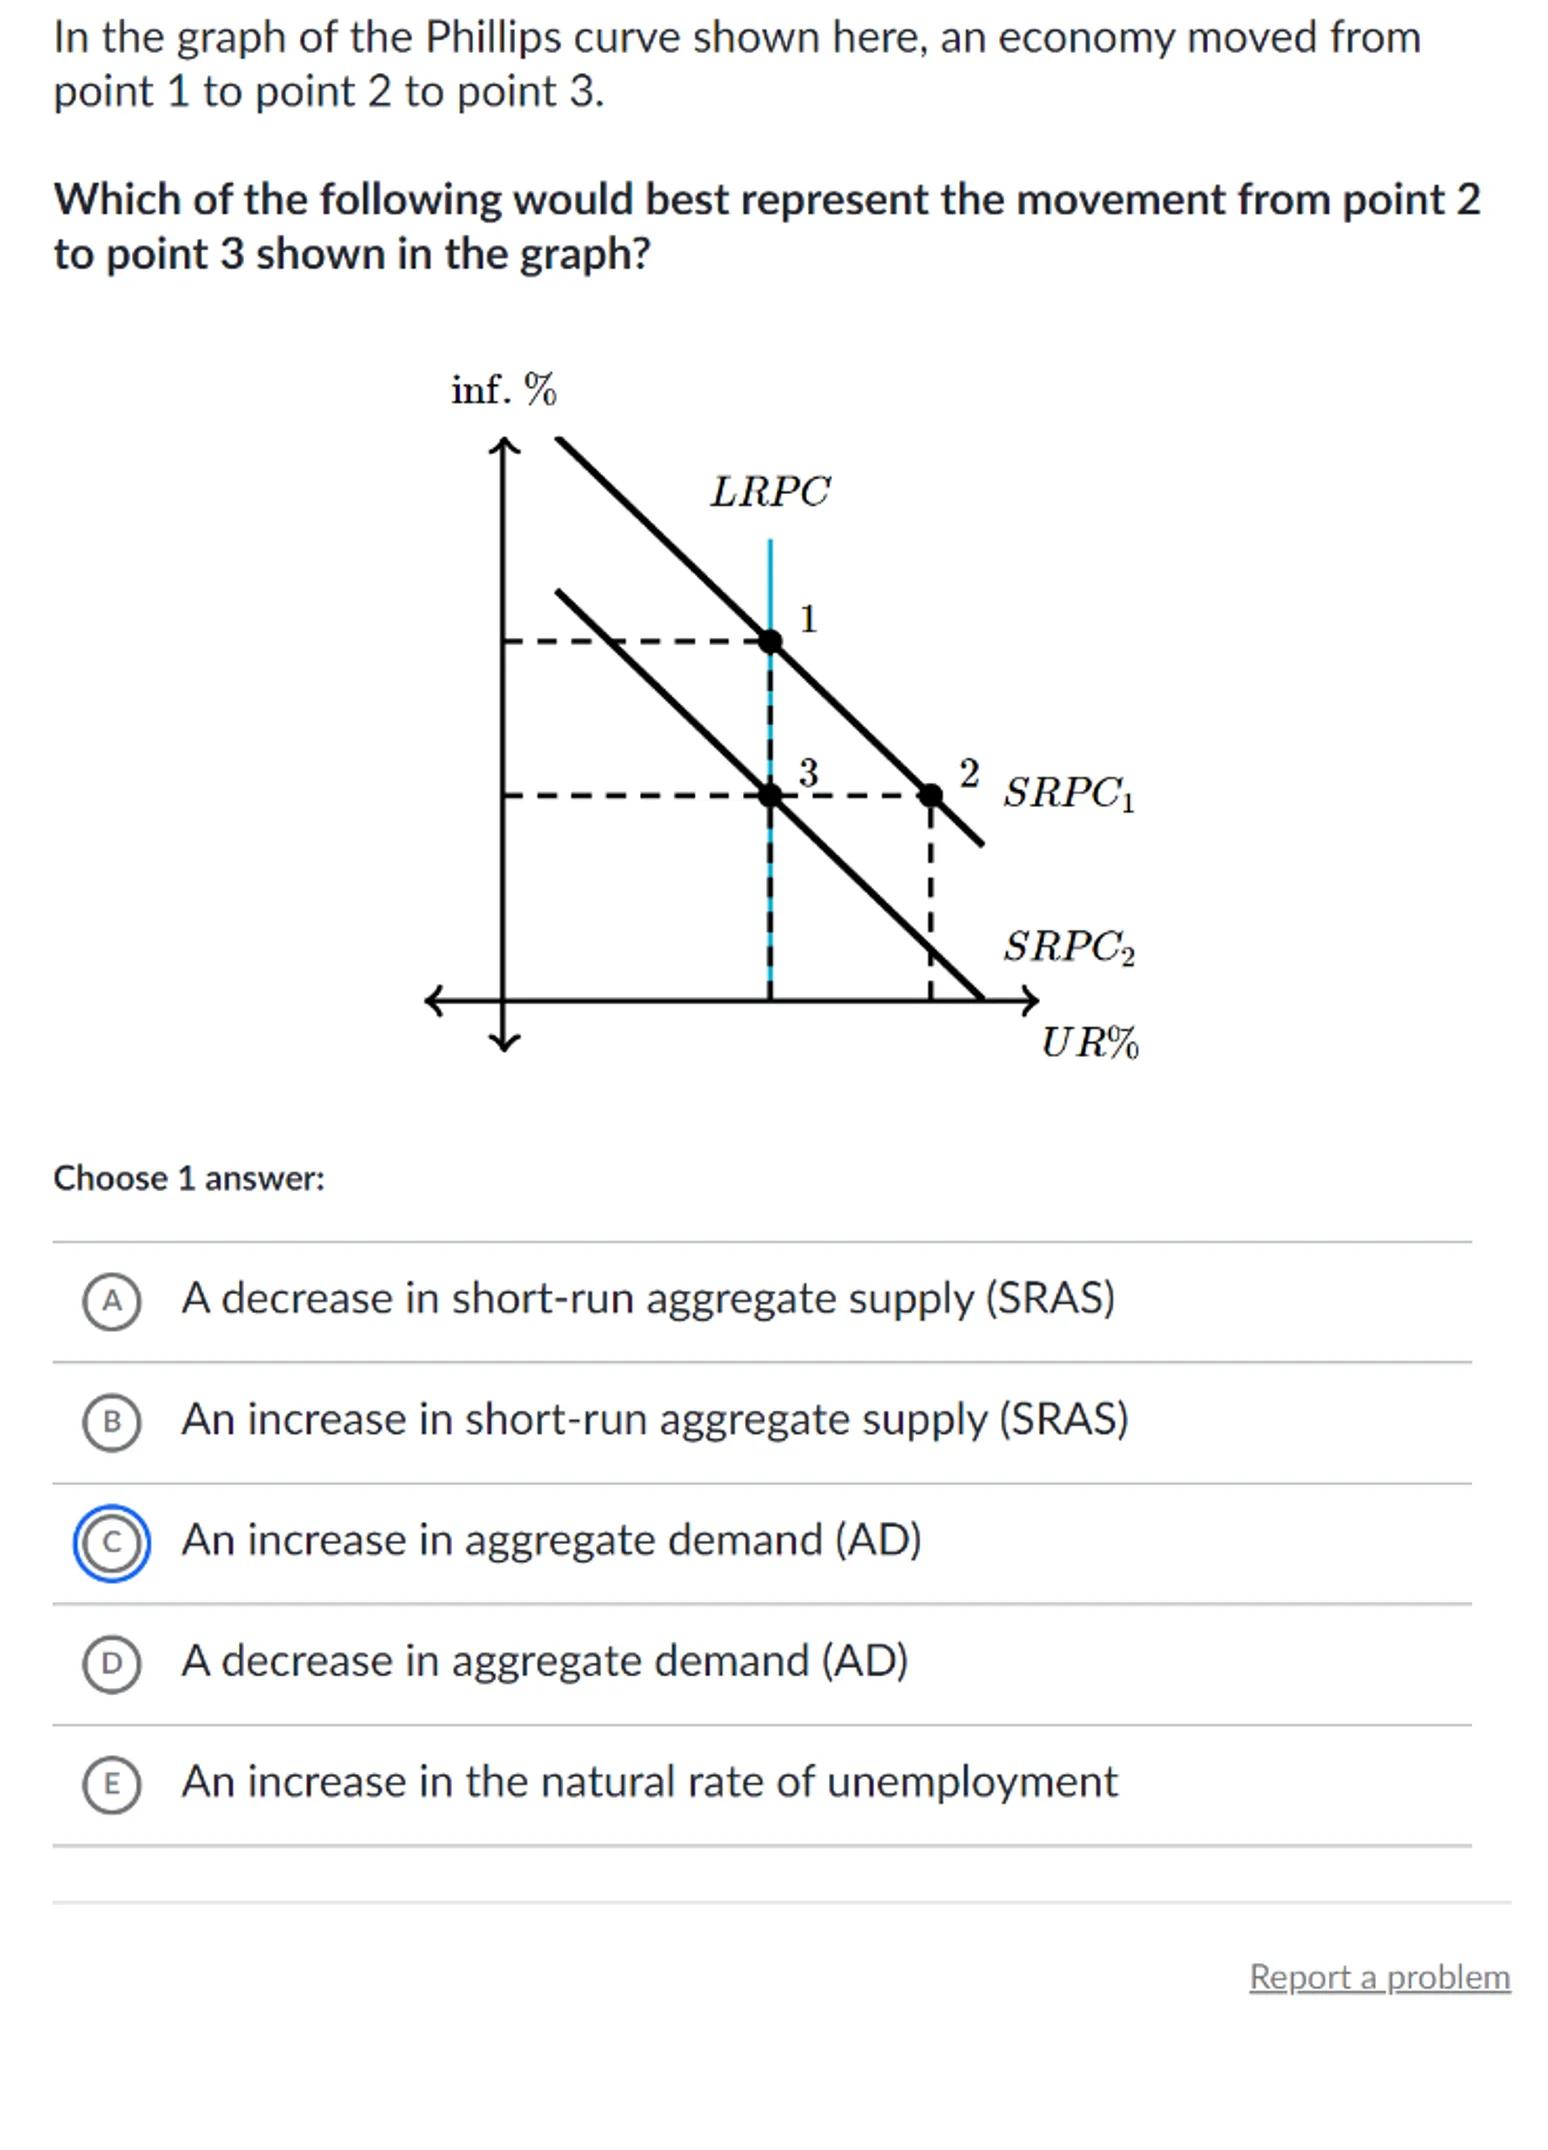
In the graph of the Phillips curve shown here, an economy moved from point 1 to point 2 to point 3.

Which of the following would best represent the movement from point 2 to point 3 shown in the graph?

Choose 1 answer:
(A) A decrease in short-run aggregate supply (SRAS)
(B) An increase in short-run aggregate supply (SRAS)
(C) An increase in aggregate demand (AD)
(D) A decrease in aggregate demand (AD)
(E) An increase in the natural rate of unemployment
Report a problem

Answer from Sia
Posted over 1 year ago
Solution by Steps
step 1
Identify the movement on the Phillips curve graph. The economy moves from point 2 to point 3, which are both on the short-run Phillips curves (SRPC1 and SRPC2)
step 2
Note that the movement from point 2 to point 3 involves a shift from one short-run Phillips curve (SRPC1) to another (SRPC2). This indicates a change in the short-run aggregate supply (SRAS)
step 3
Determine the direction of the shift. Since the movement is from SRPC1 to SRPC2, which is to the left, it suggests a decrease in short-run aggregate supply (SRAS)
Answer
A
Key Concept
Short-run Phillips curve (SRPC) shifts
Explanation
A movement from one SRPC to another typically indicates a change in short-run aggregate supply (SRAS). A leftward shift in the SRPC, as seen from point 2 to point 3, corresponds to a decrease in SRAS.
Not the question you are looking for? Ask here!
Enter question by text
Enter question by image
Unlock Smarter Learning with AskSia Super!
Join Super, our all-in-one AI solution that can greatly improve your learning efficiency.
30% higher accuracy than GPT-4o
Entire learning journey support
The most student-friendly features
Study Other Question