Sia

Question
Microeconomics
Posted over 1 year ago
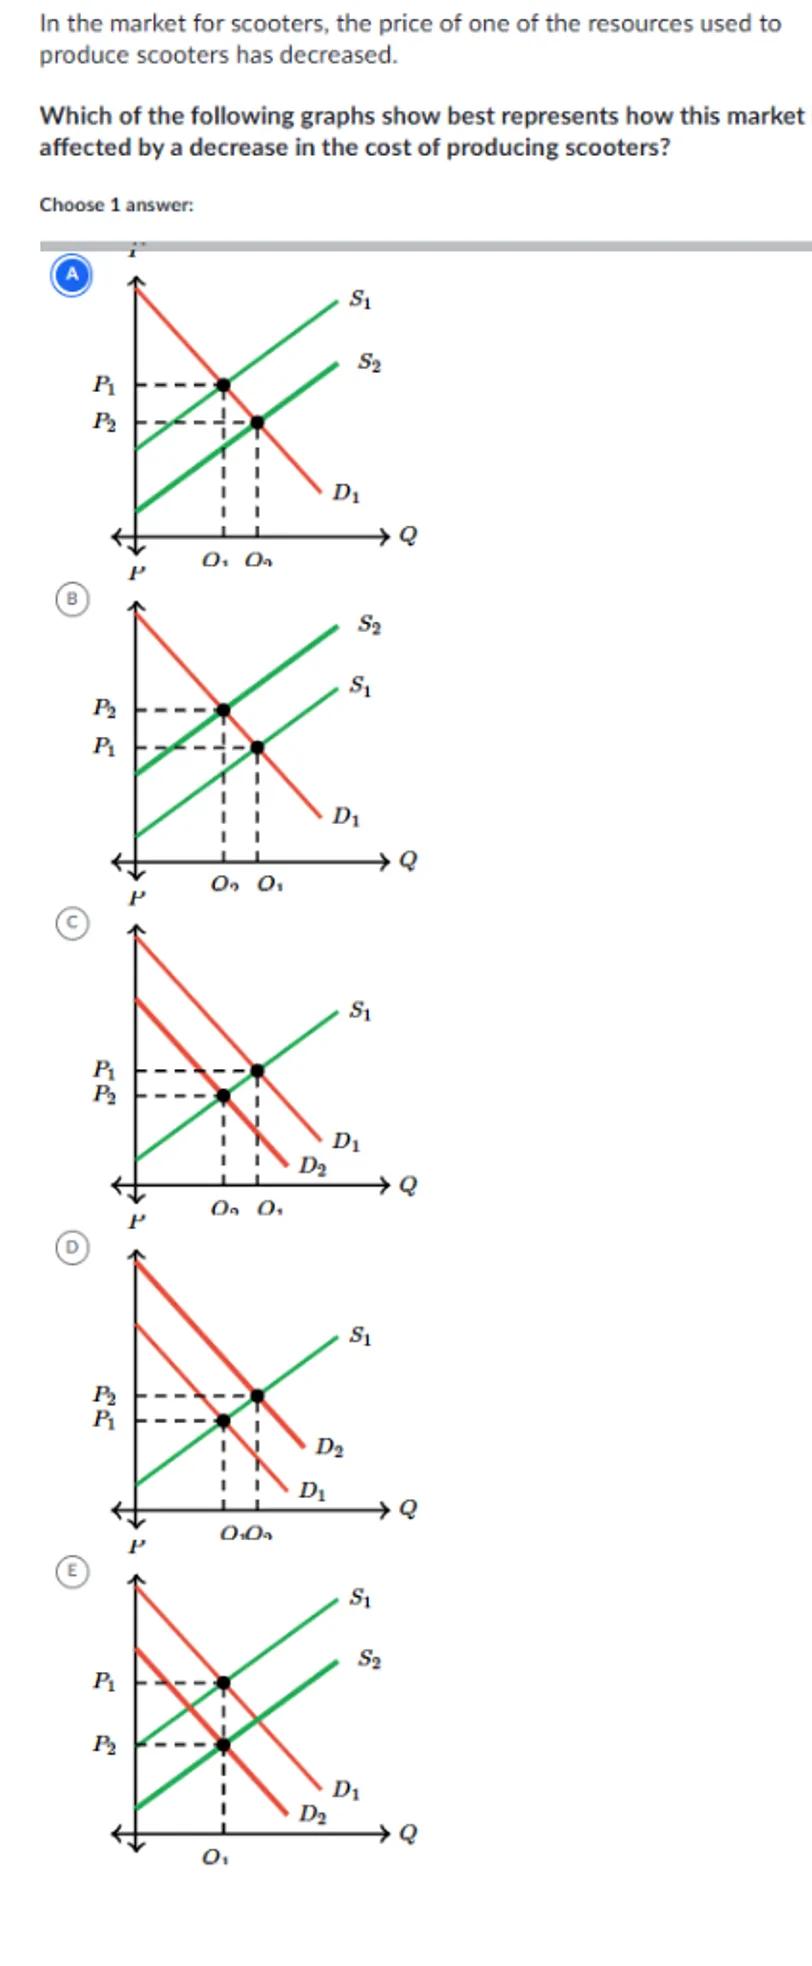
In the market for scooters, the price of one of the resources used to produce scooters has decreased.

Which of the following graphs show best represents how this market affected by a decrease in the cost of producing scooters?

Choose 1 answer:
(A)
(B)
(C)
(D)
(E)

Answer from Sia
Posted over 1 year ago
Solution
a
Decrease in Production Cost: When the cost of producing scooters decreases, the supply curve shifts to the right. This is because producers are willing to supply more scooters at each price level due to the lower production costs
b
Graph Analysis: In the given graphs, we need to identify the one where the supply curve shifts to the right, indicating an increase in supply
c
Graph E: Graph E shows both the demand curve shifting to the right (D1 to D2) and the supply curve shifting to the right (S1 to S2). This represents an increase in both demand and supply. However, since the question specifically asks about the effect of a decrease in production cost, we focus on the supply shift
d
Correct Graph: Graph A shows the supply curve shifting to the right (S1 to S2) while the demand curve remains unchanged (D1). This best represents the market affected by a decrease in the cost of producing scooters
Answer
Graph A
Key Concept
Supply Curve Shift
Explanation
A decrease in the cost of production leads to an increase in supply, which is represented by a rightward shift of the supply curve. Graph A accurately depicts this scenario.
Not the question you are looking for? Ask here!
Enter question by text
Enter question by image
Unlock Smarter Learning with AskSia Super!
Join Super, our all-in-one AI solution that can greatly improve your learning efficiency.
30% higher accuracy than GPT-4o
Entire learning journey support
The most student-friendly features
Study Other Question