Sia
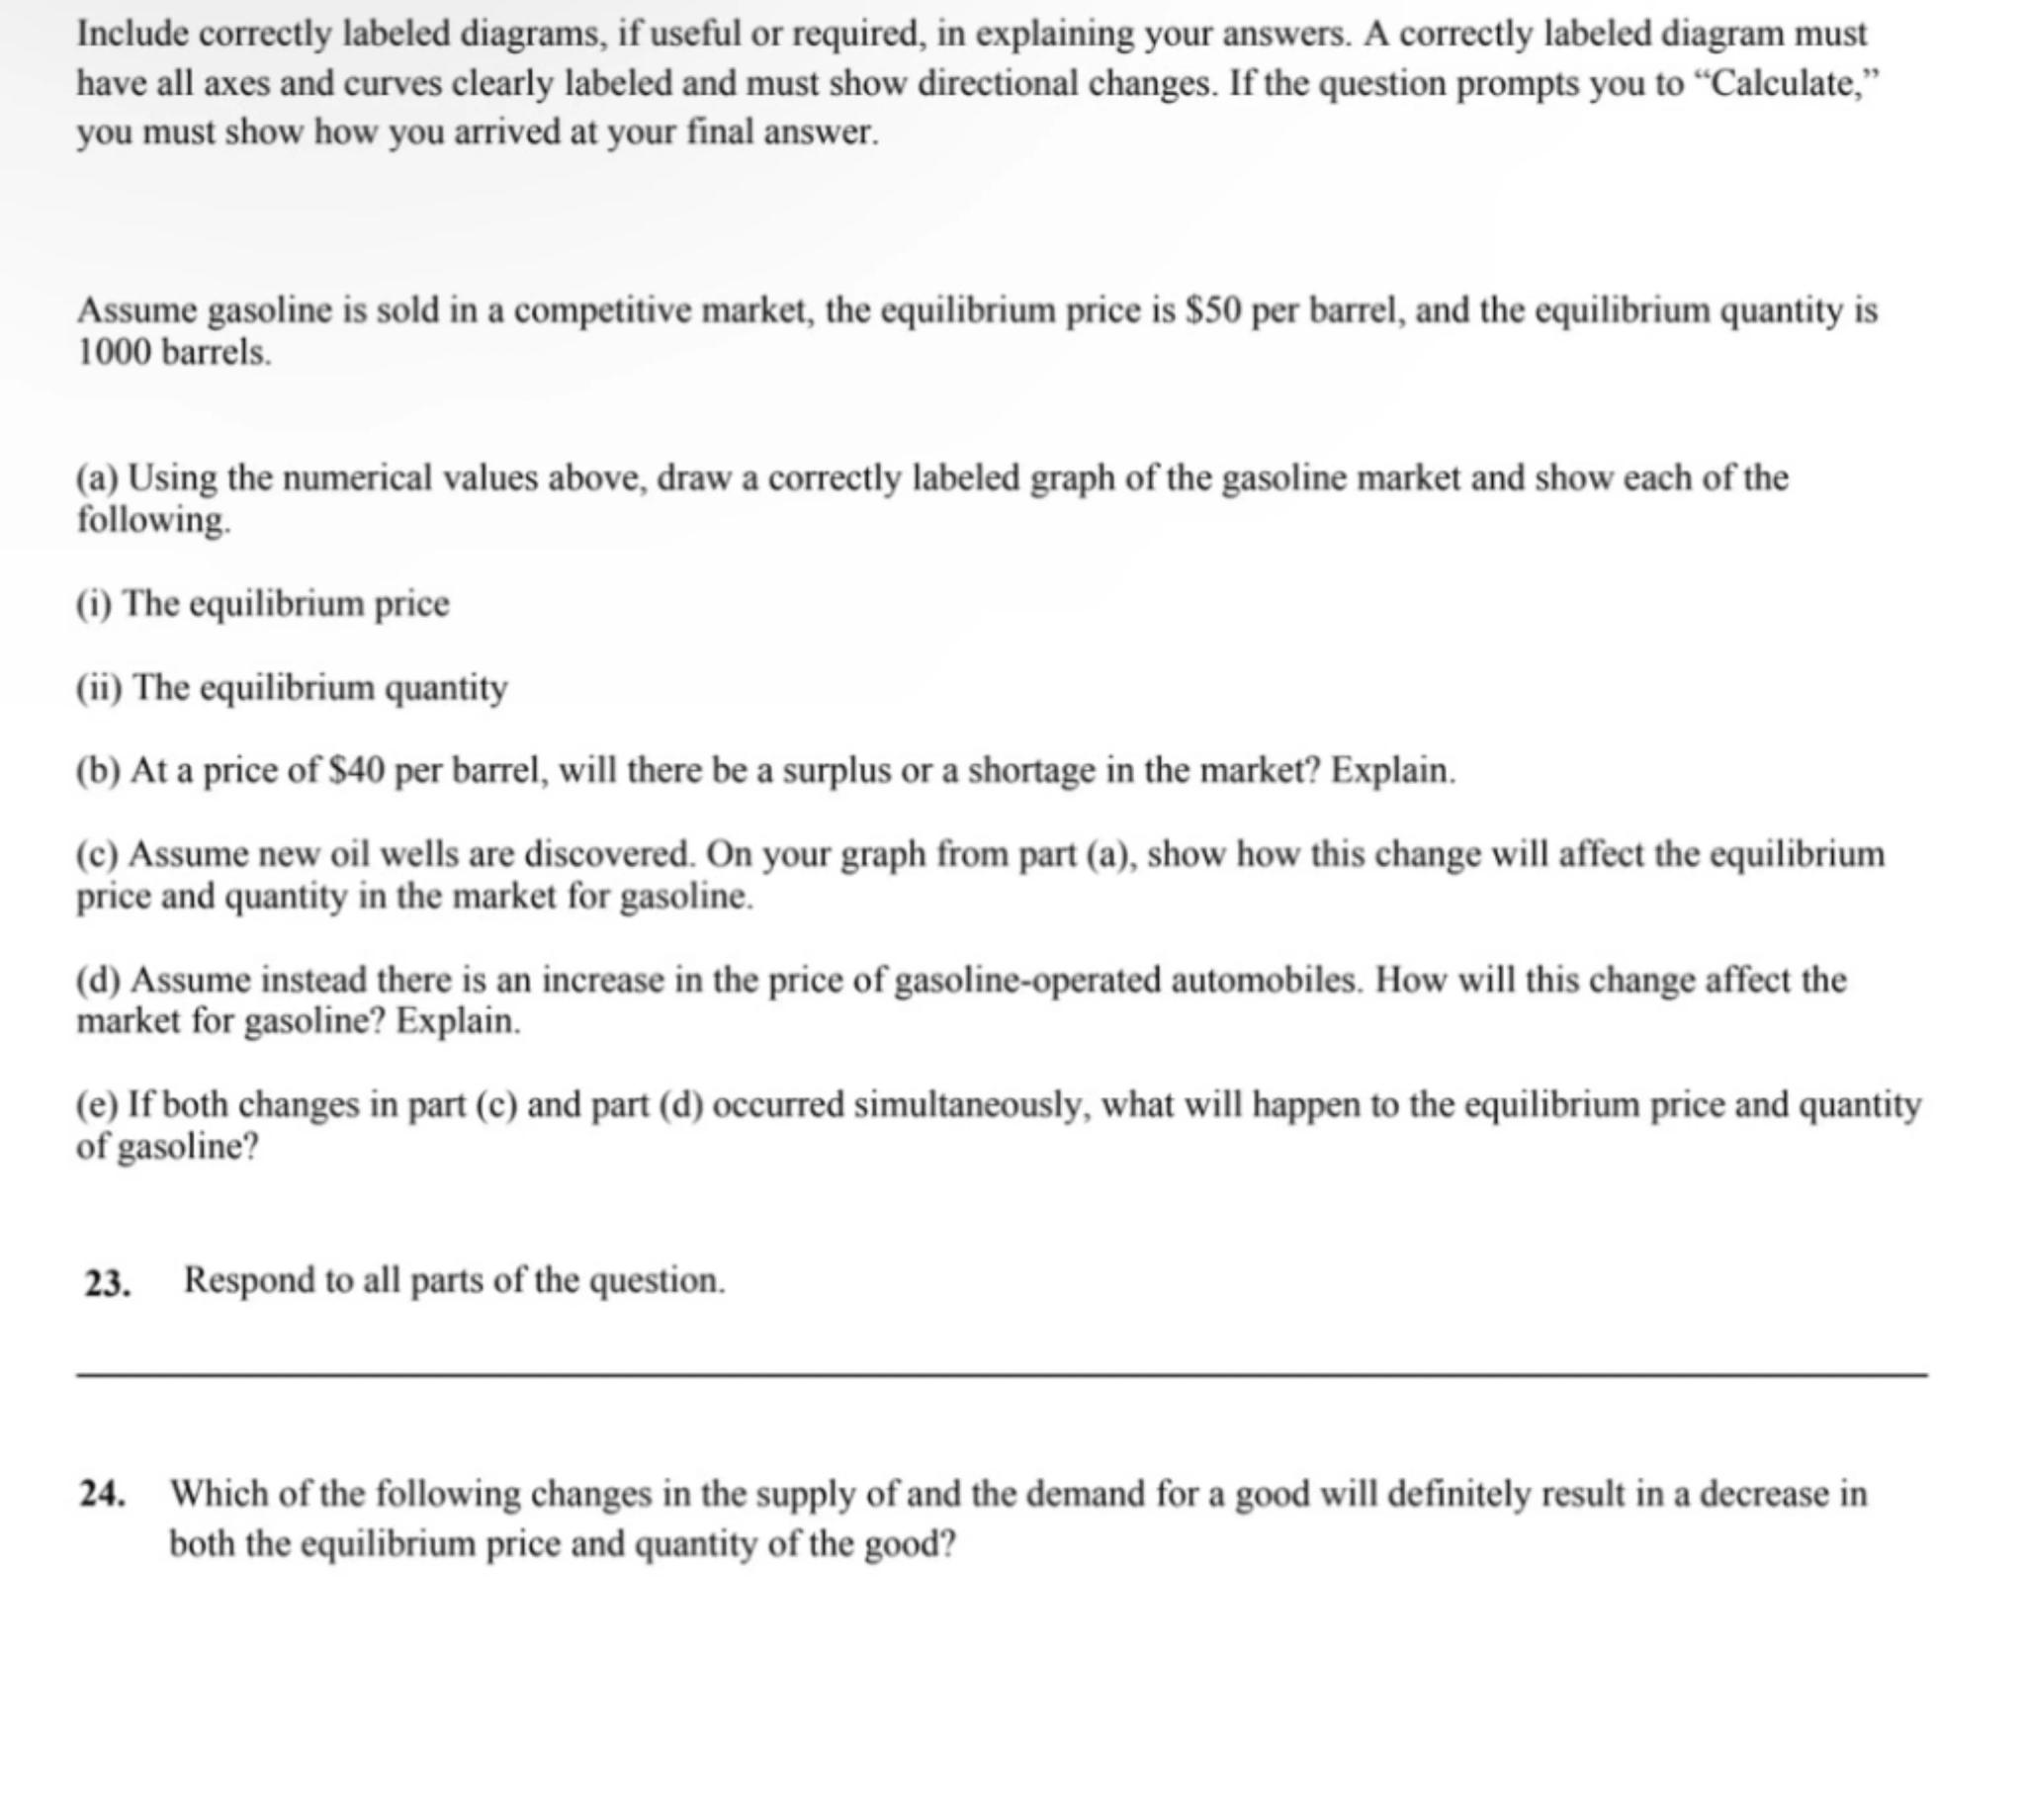
Include correctly labeled diagrams, if useful or required, in explaining your answers. A correctly labeled diagram must have all axes and curves clearly labeled and must show directional changes. If the question prompts you to "Calculate," you must show how you arrived at your final answer.
Assume gasoline is sold in a competitive market, the equilibrium price is per barrel, and the equilibrium quantity is 1000 barrels.
(a) Using the numerical values above, draw a correctly labeled graph of the gasoline market and show each of the following.
(i) The equilibrium price
(ii) The equilibrium quantity
(b) At a price of per barrel, will there be a surplus or a shortage in the market? Explain.
(c) Assume new oil wells are discovered. On your graph from part (a), show how this change will affect the equilibrium price and quantity in the market for gasoline.
(d) Assume instead there is an increase in the price of gasoline-operated automobiles. How will this change affect the market for gasoline? Explain.
(e) If both changes in part (c) and part (d) occurred simultaneously, what will happen to the equilibrium price and quantity of gasoline?
23. Respond to all parts of the question.
24. Which of the following changes in the supply of and the demand for a good will definitely result in a decrease in both the equilibrium price and quantity of the good?

Answer from Sia
Posted about 1 year ago
Solution by Steps
step 1
To draw the graph of the gasoline market, we need to label the axes. The vertical axis represents the price of gasoline (in dollars per barrel), and the horizontal axis represents the quantity of gasoline (in barrels). The equilibrium price is $50, and the equilibrium quantity is 1000 barrels. We plot the point (1000, 50) on the graph
step 2
The equilibrium price is represented by a horizontal line at $50 on the price axis, and the equilibrium quantity is represented by a vertical line at 1000 barrels on the quantity axis. The intersection of these two lines indicates the equilibrium point
step 3
At a price of $40 per barrel, the price is below the equilibrium price. This will lead to a shortage in the market because the quantity demanded will exceed the quantity supplied at this lower price
step 4
If new oil wells are discovered, this will increase the supply of gasoline. On the graph, we would shift the supply curve to the right, leading to a new equilibrium price that is lower than $50 and a new equilibrium quantity that is higher than 1000 barrels
step 5
An increase in the price of gasoline-operated automobiles will decrease the demand for gasoline. On the graph, we would shift the demand curve to the left, leading to a new equilibrium price that is lower than $50 and a new equilibrium quantity that is lower than 1000 barrels
step 6
If both changes from part (c) and part (d) occur simultaneously, the supply will increase (shifting right) and demand will decrease (shifting left). The overall effect on equilibrium price is uncertain, but the equilibrium quantity will definitely increase due to the increase in supply
Answer
The equilibrium price will likely decrease or remain the same, while the equilibrium quantity will increase.
Key Concept
Market equilibrium, supply and demand shifts
Explanation
Changes in supply and demand affect the equilibrium price and quantity in a market. An increase in supply typically lowers prices, while a decrease in demand also lowers prices, but the overall effect on equilibrium price can vary depending on the magnitude of the shifts.
Not the question you are looking for? Ask here!
Enter question by text
Enter question by image
Unlock Smarter Learning with AskSia Super!
Join Super, our all-in-one AI solution that can greatly improve your learning efficiency.
30% higher accuracy than GPT-4o
Entire learning journey support
The most student-friendly features
Study Other Question
