
AskSia

Question
Math
Posted about 2 years ago
Julio distributed a survey to his fellow students asking them how many hours they spent playing sports in the past day. He also asked them to rate their mood on a scale from 0 to 10 , with 10 being the happiest. Julio created the following scatterplot and regression line to show this relationship.
The fitted line has a -intercept of 5 .
What is the best interpretation of this -intercept?
Choose 1 answer:
(A) Students who had a mood rating of 0 must have spent 5 hours playing sports.
(B) The average mood rating was 5 .
(C) The model indicates that students who had a mood rating of 0 will spend approximately 5 hours playing sports.
(D) The model indicates that students who spent 0 hours playing sports will have an average mood rating of 5 .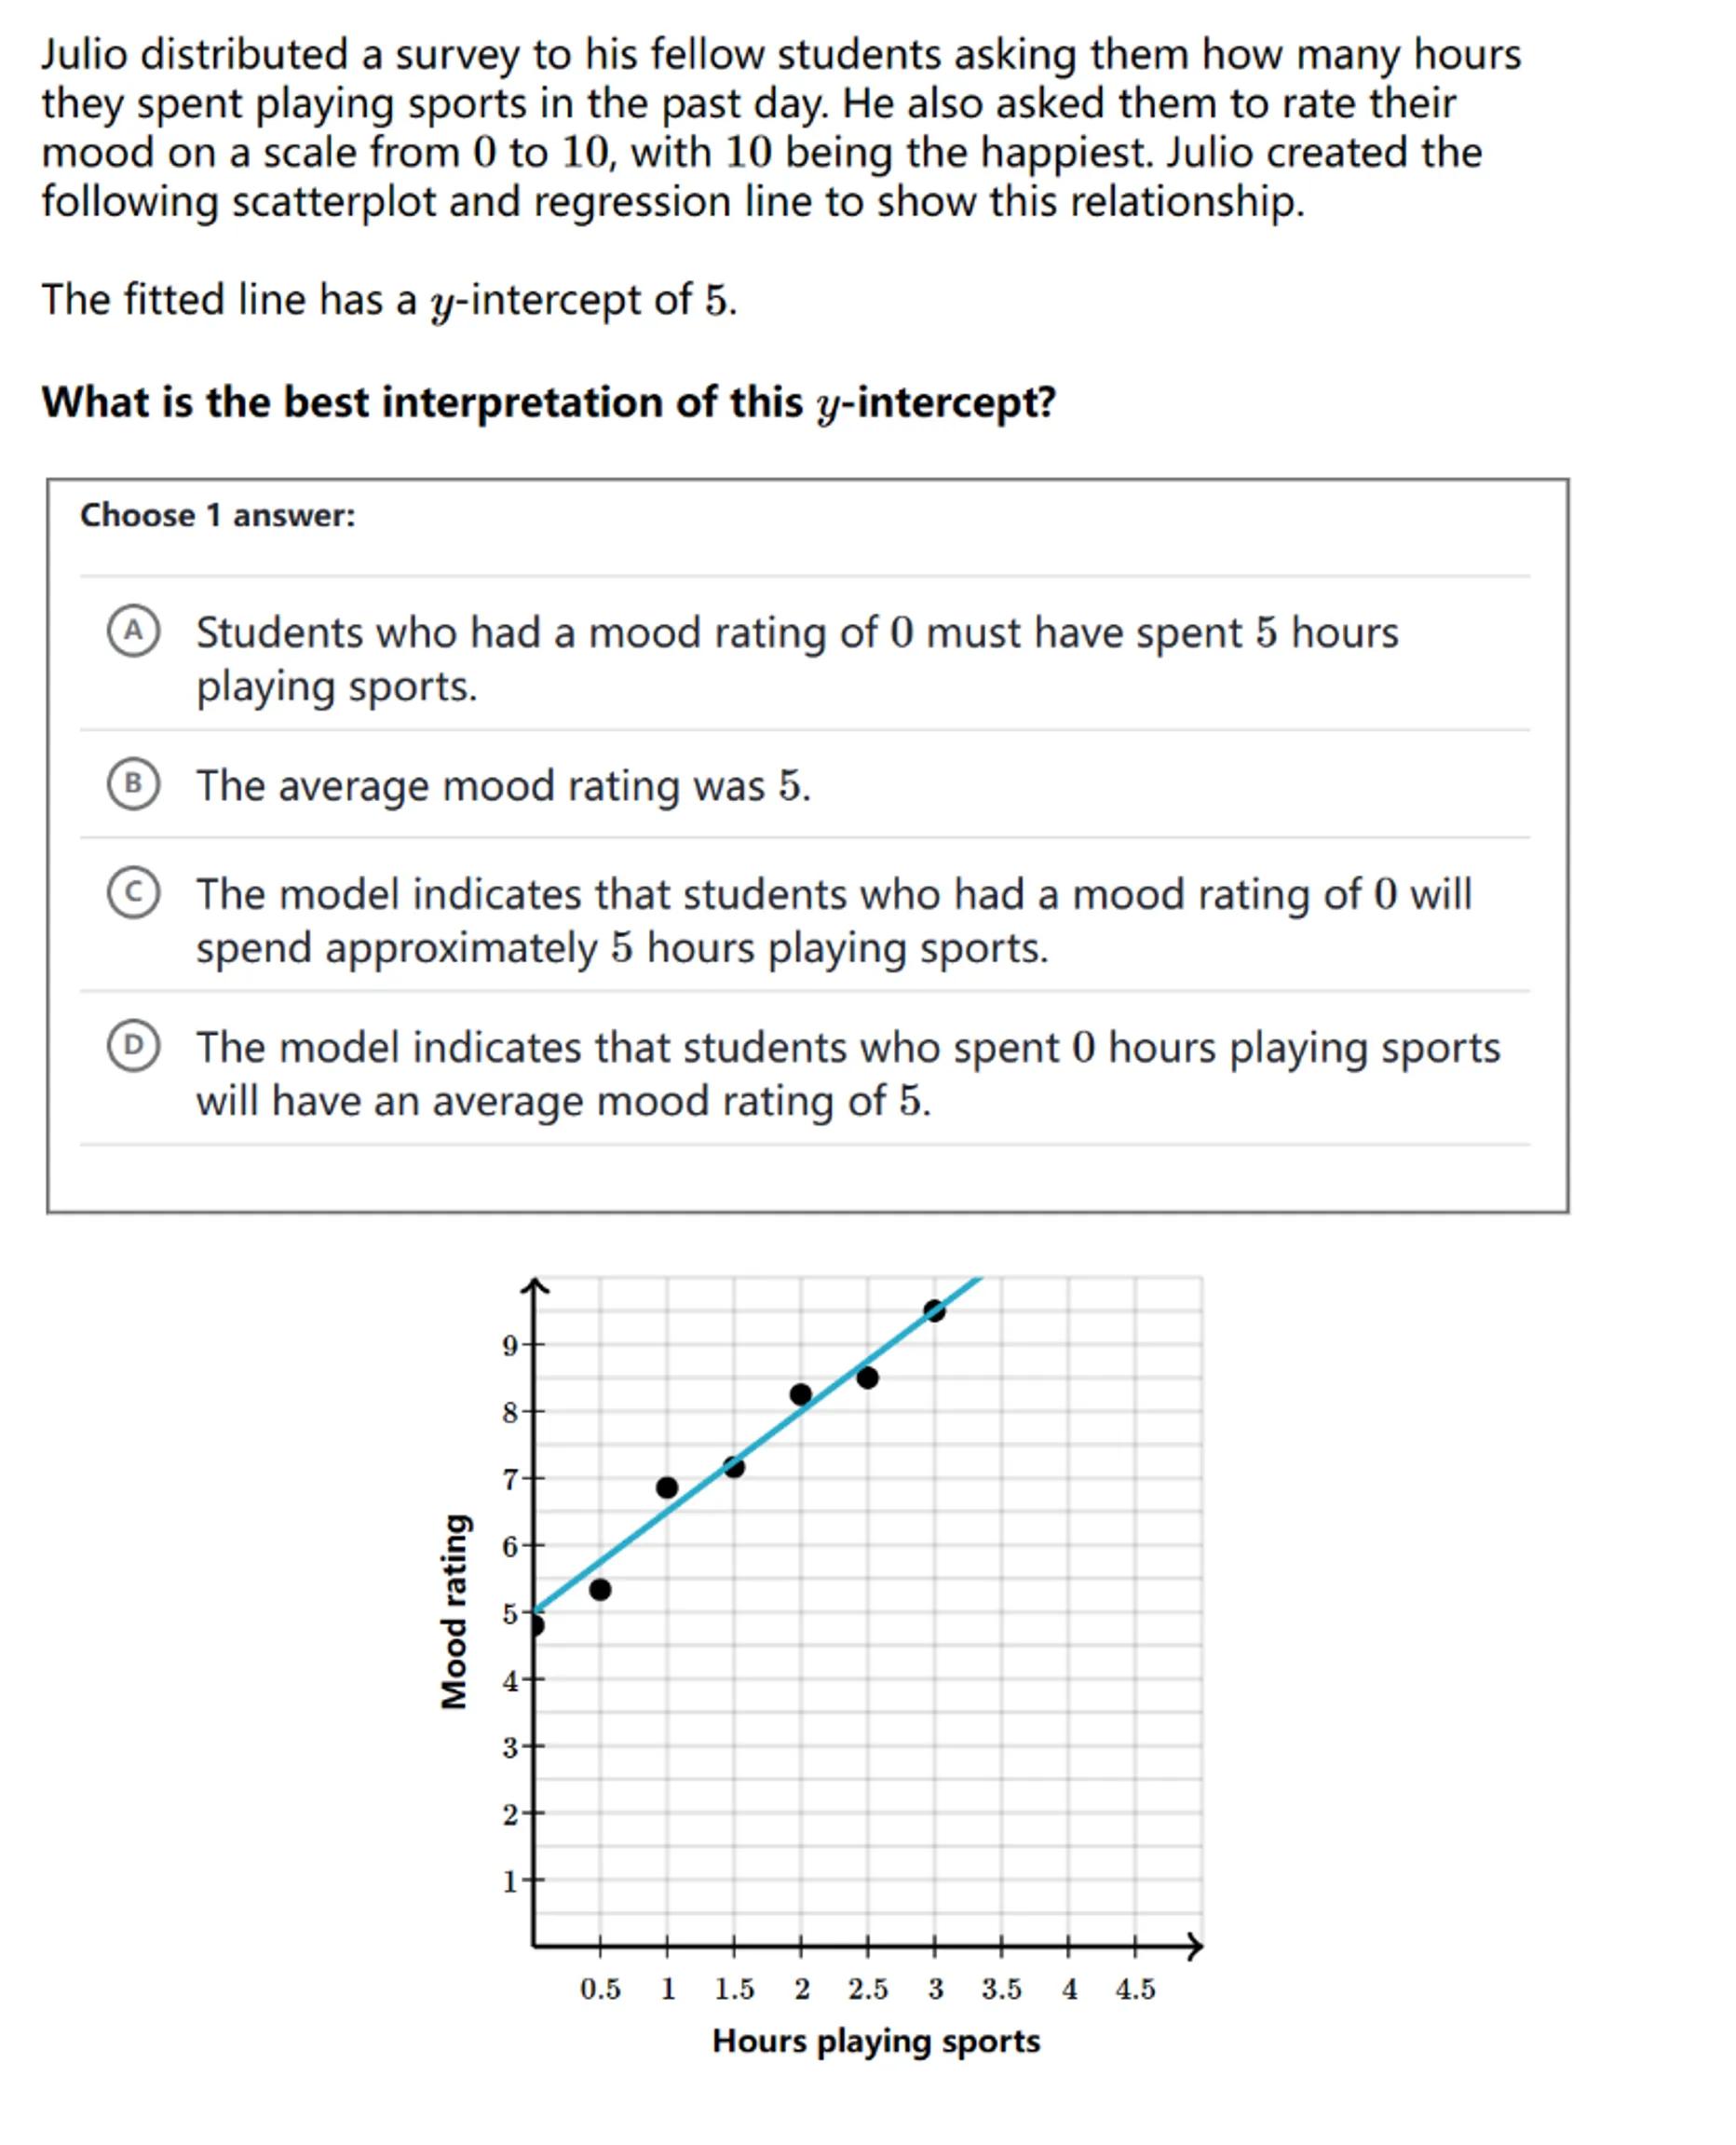
 Sign in to unlock the answer
Answer from Sia
Posted about 2 years ago
Solution by Steps
step 2
In this context, the dependent variable is "Mood rating" and the independent variable is "Hours playing sports." Therefore, the -intercept of 5 indicates the expected mood rating for a student who spent 0 hours playing sports
step 3
Evaluate the given answer choices in the context of the interpretation of the -intercept
1 Answer
D
Key Concept
-intercept of a regression line
Explanation
The -intercept of a regression line represents the expected value of the dependent variable when the independent variable is zero.
Not the question you are looking for? Ask here!
Enter question by text
Enter question by image

Unlock Smarter Learning with AskSia Super!
Join Super, our all-in-one AI solution that can greatly improve your learning efficiency.
30% higher accuracy than GPT-4o
Entire learning journey support
The most student-friendly features

Study Other Question