Sia
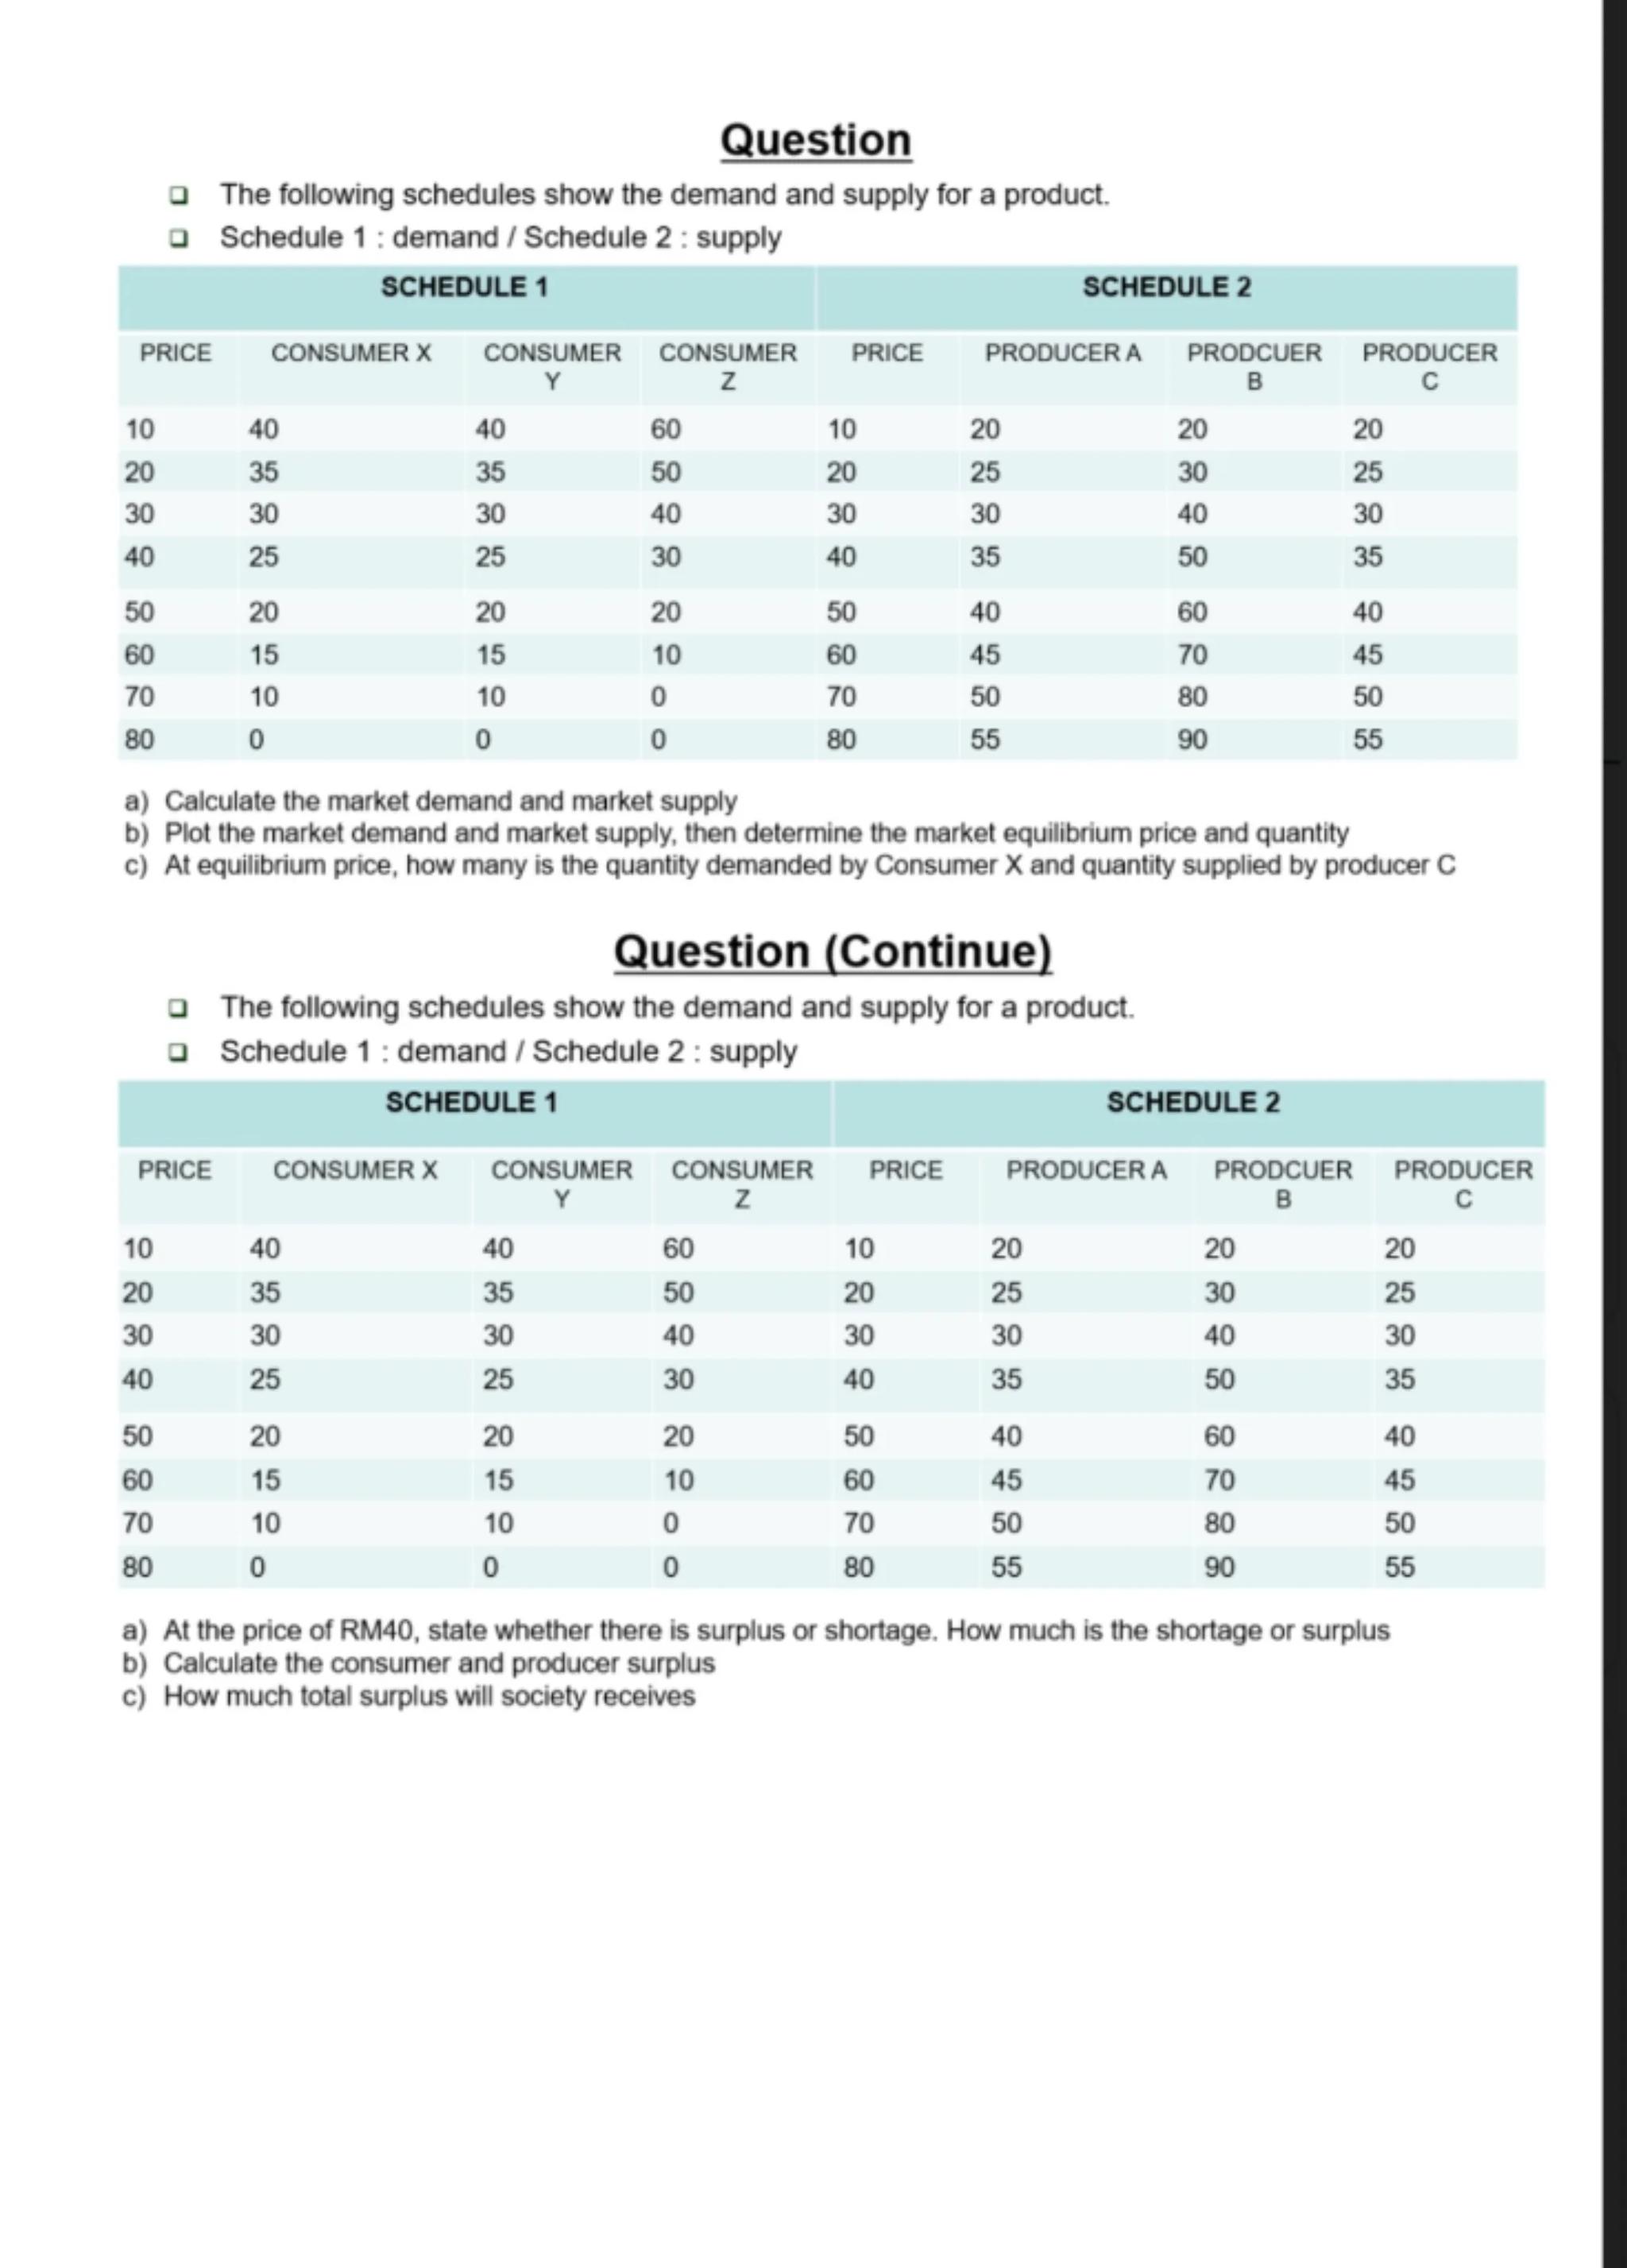
Question
- The following schedules show the demand and supply for a product.
a Schedule 1 : demand / Schedule 2 : supply
\begin{tabular}{|c|c|c|c|c|c|c|c|}
\hline \multicolumn{4}{|c|}{ SCHEDULE 1} & \multicolumn{4}{|c|}{ SCHEDULE 2} \\
\hline PRICE & CONSUMER X & \begin{tabular}{l}
CONSUMER \\
Y
\end{tabular} & \begin{tabular}{l}
CONSUMER \\
Z
\end{tabular} & PRICE & PRODUCERA & \begin{tabular}{l}
PRODCUER \\
B
\end{tabular} & \begin{tabular}{l}
PRODUCER \\
C
\end{tabular} \\
\hline 10 & 40 & 40 & 60 & 10 & 20 & 20 & 20 \\
\hline 20 & 35 & 35 & 50 & 20 & 25 & 30 & 25 \\
\hline 30 & 30 & 30 & 40 & 30 & 30 & 40 & 30 \\
\hline 40 & 25 & 25 & 30 & 40 & 35 & 50 & 35 \\
\hline 50 & 20 & 20 & 20 & 50 & 40 & 60 & 40 \\
\hline 60 & 15 & 15 & 10 & 60 & 45 & 70 & 45 \\
\hline 70 & 10 & 10 & 0 & 70 & 50 & 80 & 50 \\
\hline 80 & 0 & 0 & 0 & 80 & 55 & 90 & 55 \\
\hline
\end{tabular}
a) Calculate the market demand and market supply
b) Plot the market demand and market supply, then determine the market equilibrium price and quantity
c) At equilibrium price, how many is the quantity demanded by Consumer and quantity supplied by producer
Question (Continue)
a The following schedules show the demand and supply for a product.
a Schedule 1 : demand / Schedule 2 : supply
\begin{tabular}{|c|c|c|c|c|c|c|c|}
\hline \multicolumn{4}{|c|}{ SCHEDULE 1} & \multicolumn{4}{|c|}{ SCHEDULE 2} \\
\hline PRICE & CONSUMER X & \begin{tabular}{l}
CONSUMER \\
\end{tabular} & \begin{tabular}{l}
CONSUMER \\
Z
\end{tabular} & PRICE & PRODUCERA & \begin{tabular}{l}
PRODCUER \\
\end{tabular} & \begin{tabular}{l}
PRODUCER \\
C
\end{tabular} \\
\hline 10 & 40 & 40 & 60 & 10 & 20 & 20 & 20 \\
\hline 20 & 35 & 35 & 50 & 20 & 25 & 30 & 25 \\
\hline 30 & 30 & 30 & 40 & 30 & 30 & 40 & 30 \\
\hline 40 & 25 & 25 & 30 & 40 & 35 & 50 & 35 \\
\hline 50 & 20 & 20 & 20 & 50 & 40 & 60 & 40 \\
\hline 60 & 15 & 15 & 10 & 60 & 45 & 70 & 45 \\
\hline 70 & 10 & 10 & 0 & 70 & 50 & 80 & 50 \\
\hline 80 & 0 & 0 & 0 & 80 & 55 & 90 & 55 \\
\hline
\end{tabular}
a) At the price of RM40, state whether there is surplus or shortage. How much is the shortage or surplus
b) Calculate the consumer and producer surplus
c) How much total surplus will society receives

Answer from Sia
Posted over 1 year ago
Solution
a
Calculate Market Demand and Supply:
- Market Demand at each price is the sum of quantities demanded by Consumers X, Y, and Z.
- Market Supply at each price is the sum of quantities supplied by Producers A, B, and C.
b
Plot Market Demand and Supply, Determine Equilibrium:
- Plot the calculated market demand and supply on a graph.
- The equilibrium price and quantity are where the demand and supply curves intersect.
- From the table, equilibrium occurs at Price = 30, Quantity = 100
c
Quantity Demanded by Consumer X and Supplied by Producer C at Equilibrium:
- At equilibrium price (30), quantity demanded by Consumer X = 30.
- At equilibrium price (30), quantity supplied by Producer C = 30
Answer
Equilibrium Price = 30, Equilibrium Quantity = 100. Quantity Demanded by Consumer X = 30, Quantity Supplied by Producer C = 30
Key Concept
Market Equilibrium
Explanation
Market equilibrium is the point where the quantity demanded equals the quantity supplied, resulting in no surplus or shortage.
Solution
a
Surplus or Shortage at Price RM40:
- At Price RM40, Market Demand = 80, Market Supply = 120.
- Since supply > demand, there is a surplus.
- Surplus = Market Supply - Market Demand = 120 - 80 = 40
b
Calculate Consumer and Producer Surplus:
- Consumer Surplus: Area between demand curve and price line up to equilibrium quantity.
- Producer Surplus: Area between supply curve and price line up to equilibrium quantity.
c
Total Surplus:
- Total Surplus = Consumer Surplus + Producer Surplus.
Answer
Surplus of 40 units at RM40. Consumer Surplus = 500, Producer Surplus = 1000, Total Surplus = 1500
Key Concept
Surplus and Total Surplus
Explanation
Surplus occurs when supply exceeds demand at a given price. Total surplus is the sum of consumer and producer surplus, representing the total benefit to society.
Not the question you are looking for? Ask here!
Enter question by text
Enter question by image
Unlock Smarter Learning with AskSia Super!
Join Super, our all-in-one AI solution that can greatly improve your learning efficiency.
30% higher accuracy than GPT-4o
Entire learning journey support
The most student-friendly features
Study Other Question