
AskSia

青州's Question
Chemistry
Posted about 2 years ago
Question 5 Answer all questions [20 marks in total]
Gas chromatograph was used in monitoring the reduction of nitrobenzene. A calibration curve was given based the table.
\begin{tabular}{|c|c|c|c|}
\hline aniline/mM & \begin{tabular}{l}
dodecane/mM \\
b.p.
\end{tabular} & \begin{tabular}{c}
Area \\
(aniline)
\end{tabular} & \begin{tabular}{c}
Area \\
(dodecane)
\end{tabular} \\
\hline 0.50 & 1.00 & 1503 & 5977 \\
\hline 0.75 & 1.00 & 2283 & 5843 \\
\hline 1.00 & 1.00 & 2987 & 5900 \\
\hline 1.25 & 1.00 & 3779 & 5905 \\
\hline 1.50 & 1.00 & 4500 & 5812 \\
\hline unknown & 1.00 & 3660 & 5783 \\
\hline
\end{tabular}
(a) Identify the peaks A, B and C. Justify your answer. (4 marks)
(b) Briefly explain how calibration curve was plotted from data of the table above. (5 marks)
(c) Calculate the unknown concentration in the table? Show your working. (4 marks)
(d) Suggest an extraction method for the separation of aniline from nitrobenzene. Justify your answer. ( 7 marks)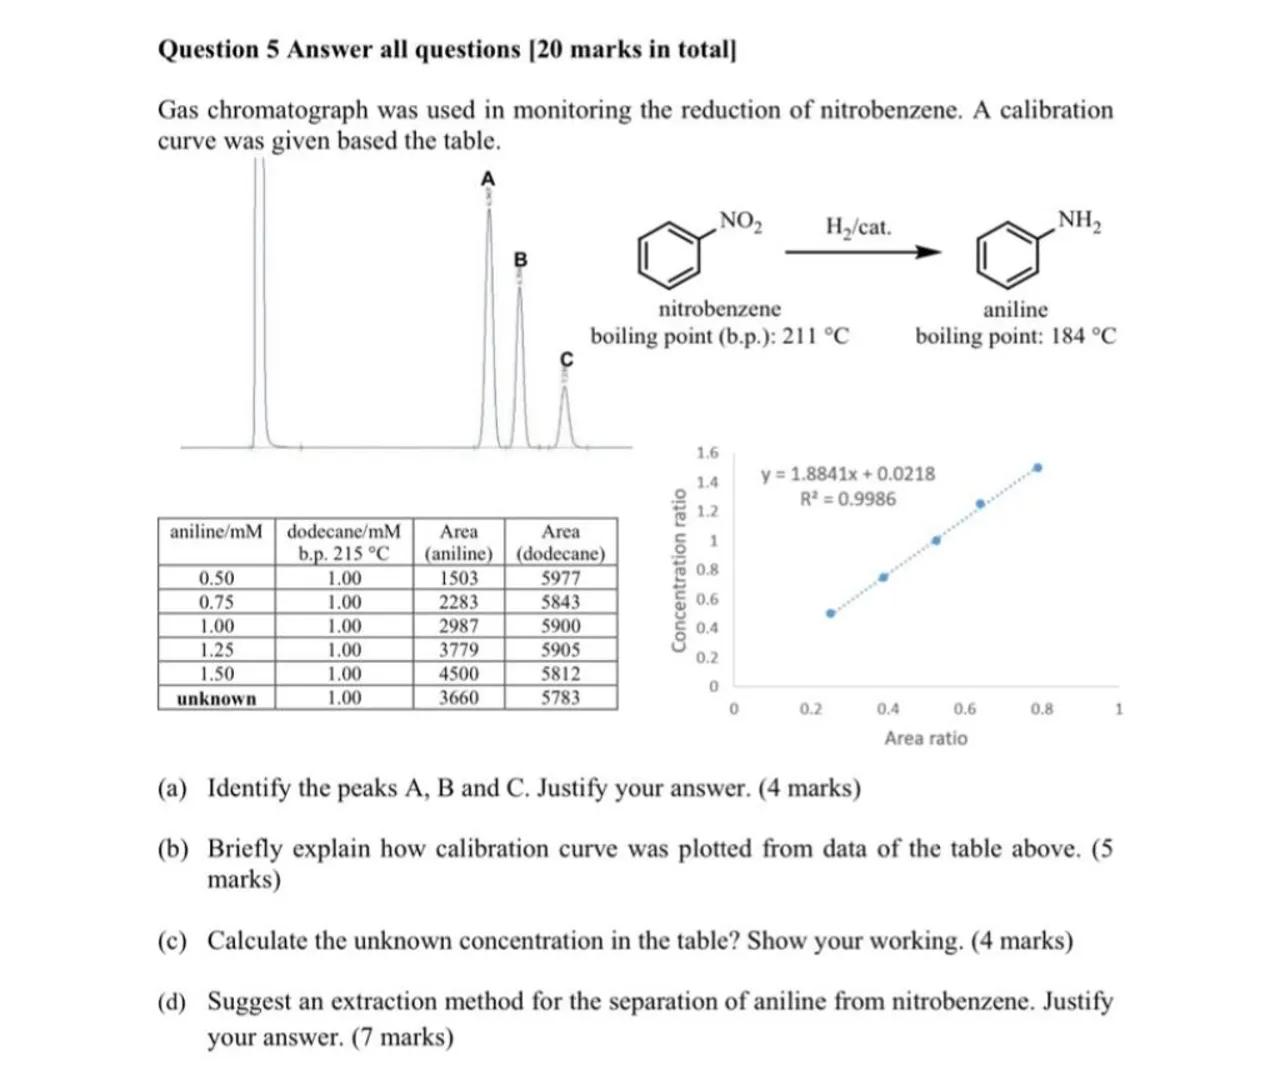
 Sign in to unlock the answer
Answer from Sia
Posted about 2 years ago
Solution
1
Identify the peaks: To identify peaks A, B, and C, we need to consider the boiling points of the substances and the order in which they would elute from the gas chromatograph. Typically, substances with lower boiling points elute first
2
Justify the identification: Given that nitrobenzene has a boiling point of and aniline has a boiling point of , aniline would elute before nitrobenzene. Therefore, peak A should correspond to aniline, peak B to nitrobenzene, and peak C could be the internal standard, dodecane, if its boiling point is higher than that of nitrobenzene
1 Answer
Peak A is aniline, Peak B is nitrobenzene, and Peak C is dodecane.
Key Concept
Gas chromatography separates compounds based on their boiling points, with lower boiling point compounds eluting first.
Explanation
Aniline has a lower boiling point than nitrobenzene, so it elutes first, followed by nitrobenzene. The internal standard typically has a different boiling point and elutes at a different time.
Solution
1
Plotting the calibration curve: The calibration curve is plotted using the area ratio of aniline to dodecane against the concentration ratio of aniline to dodecane
2
Data points: Each row in the table provides a data point for the curve, with the area ratio on the x-axis and the concentration ratio on the y-axis
3
Line of best fit: The data points are plotted on the graph, and a line of best fit is drawn through them to establish the relationship between the area ratio and the concentration ratio
2 Answer
The calibration curve was plotted using the area ratio of aniline to dodecane as the x-axis and the concentration ratio as the y-axis, with a line of best fit drawn through the data points.
Key Concept
Calibration curves are used to determine the relationship between instrument response and known concentrations.
Explanation
The curve allows for the determination of unknown concentrations based on the instrument's response, as represented by the peak areas.
Solution
1
Use the calibration curve equation: The equation of the line from the calibration curve can be used to calculate the unknown concentration of aniline
2
Calculate the area ratio for the unknown: The area ratio is the area of aniline peak divided by the area of dodecane peak for the unknown sample
3
Apply the equation: Insert the area ratio into the equation to solve for the concentration ratio, which will give the concentration of aniline since the concentration of dodecane is known
3 Answer
The unknown concentration of aniline is calculated by using the area ratio from the unknown sample in the calibration curve equation.
Key Concept
The calibration curve equation relates the area ratio to the concentration ratio, allowing for the determination of unknown concentrations.
Explanation
By inputting the area ratio of the unknown sample into the calibration curve equation, the concentration of aniline can be found.
Solution
1
Suggest an extraction method: Liquid-liquid extraction can be used to separate aniline from nitrobenzene
2
Justify the method: Aniline is more polar than nitrobenzene and will preferentially dissolve in an aqueous phase, while nitrobenzene will remain in the organic phase
3
Optimize separation: Adjusting the pH of the aqueous phase to be basic will increase the ionization of aniline, enhancing its solubility in water and improving the separation
4 Answer
Liquid-liquid extraction is suggested for the separation of aniline from nitrobenzene, with pH adjustment to enhance separation.
Key Concept
Liquid-liquid extraction separates compounds based on their differential solubility in two immiscible liquids.
Explanation
Aniline's increased solubility in a basic aqueous phase compared to nitrobenzene allows for effective separation using liquid-liquid extraction.
Not the question you are looking for? Ask here!
Enter question by text
Enter question by image

Unlock Smarter Learning with AskSia Super!
Join Super, our all-in-one AI solution that can greatly improve your learning efficiency.
30% higher accuracy than GPT-4o
Entire learning journey support
The most student-friendly features

Study Other Question