
AskSia

Question
Math
Posted about 2 years ago
Researchers surveyed recent graduates of two different universities about their income. The following two-way table displays data for the sample of graduates who responded to the survey.
Approximately what percent of graduates in the sample had an income under
Round your answer to the nearest percent.
\begin{tabular}{|c|c|c|c|}
\hline Income & University A & University B & TOTAL \\
\hline Under & 35 & 40 & 75 \\
\hline to & 90 & 63 & 153 \\
\hline and over & 35 & 37 & 72 \\
\hline TOTAL & 160 & 140 & 300 \\
\hline
\end{tabular}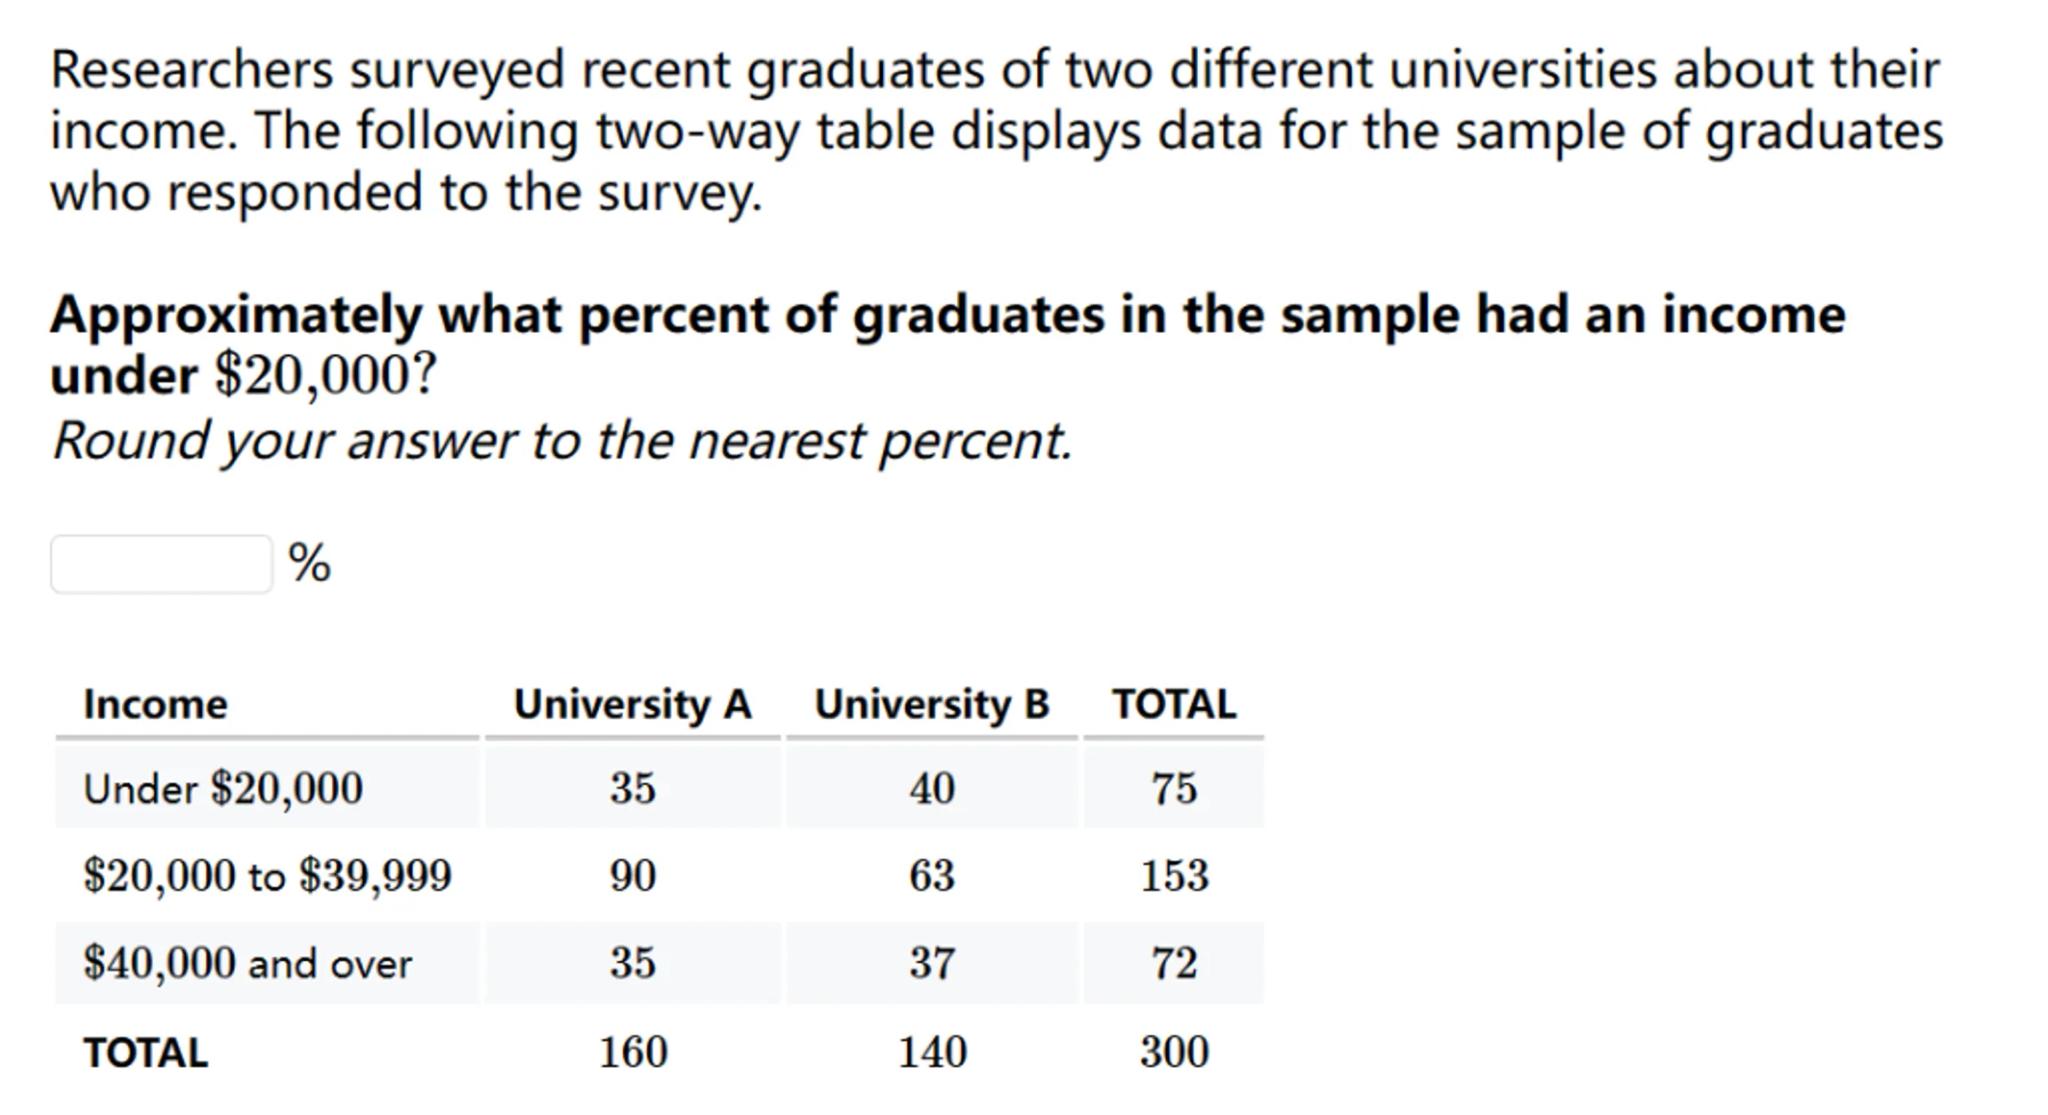
 Sign in to unlock the answer
Answer from Sia
Posted about 2 years ago
Solution by Steps
step 1
To find the percentage of graduates with an income under 20,000 by the total number of graduates surveyed
step 2
According to the table, the number of graduates earning under $20,000 is 75
step 3
The total number of graduates surveyed is 300
step 4
The percentage is calculated by the formula:
step 5
Substituting the values into the formula gives us:
Answer
Approximately 25% of graduates in the sample had an income under $20,000.
Key Concept
Percentage Calculation
Explanation
To find the percentage of a subset within a whole, divide the number of items in the subset by the total number of items, and then multiply by 100 to convert to a percentage.
Not the question you are looking for? Ask here!
Enter question by text
Enter question by image

Unlock Smarter Learning with AskSia Super!
Join Super, our all-in-one AI solution that can greatly improve your learning efficiency.
30% higher accuracy than GPT-4o
Entire learning journey support
The most student-friendly features

Study Other Question