Sia

Question
Math
Posted almost 2 years ago
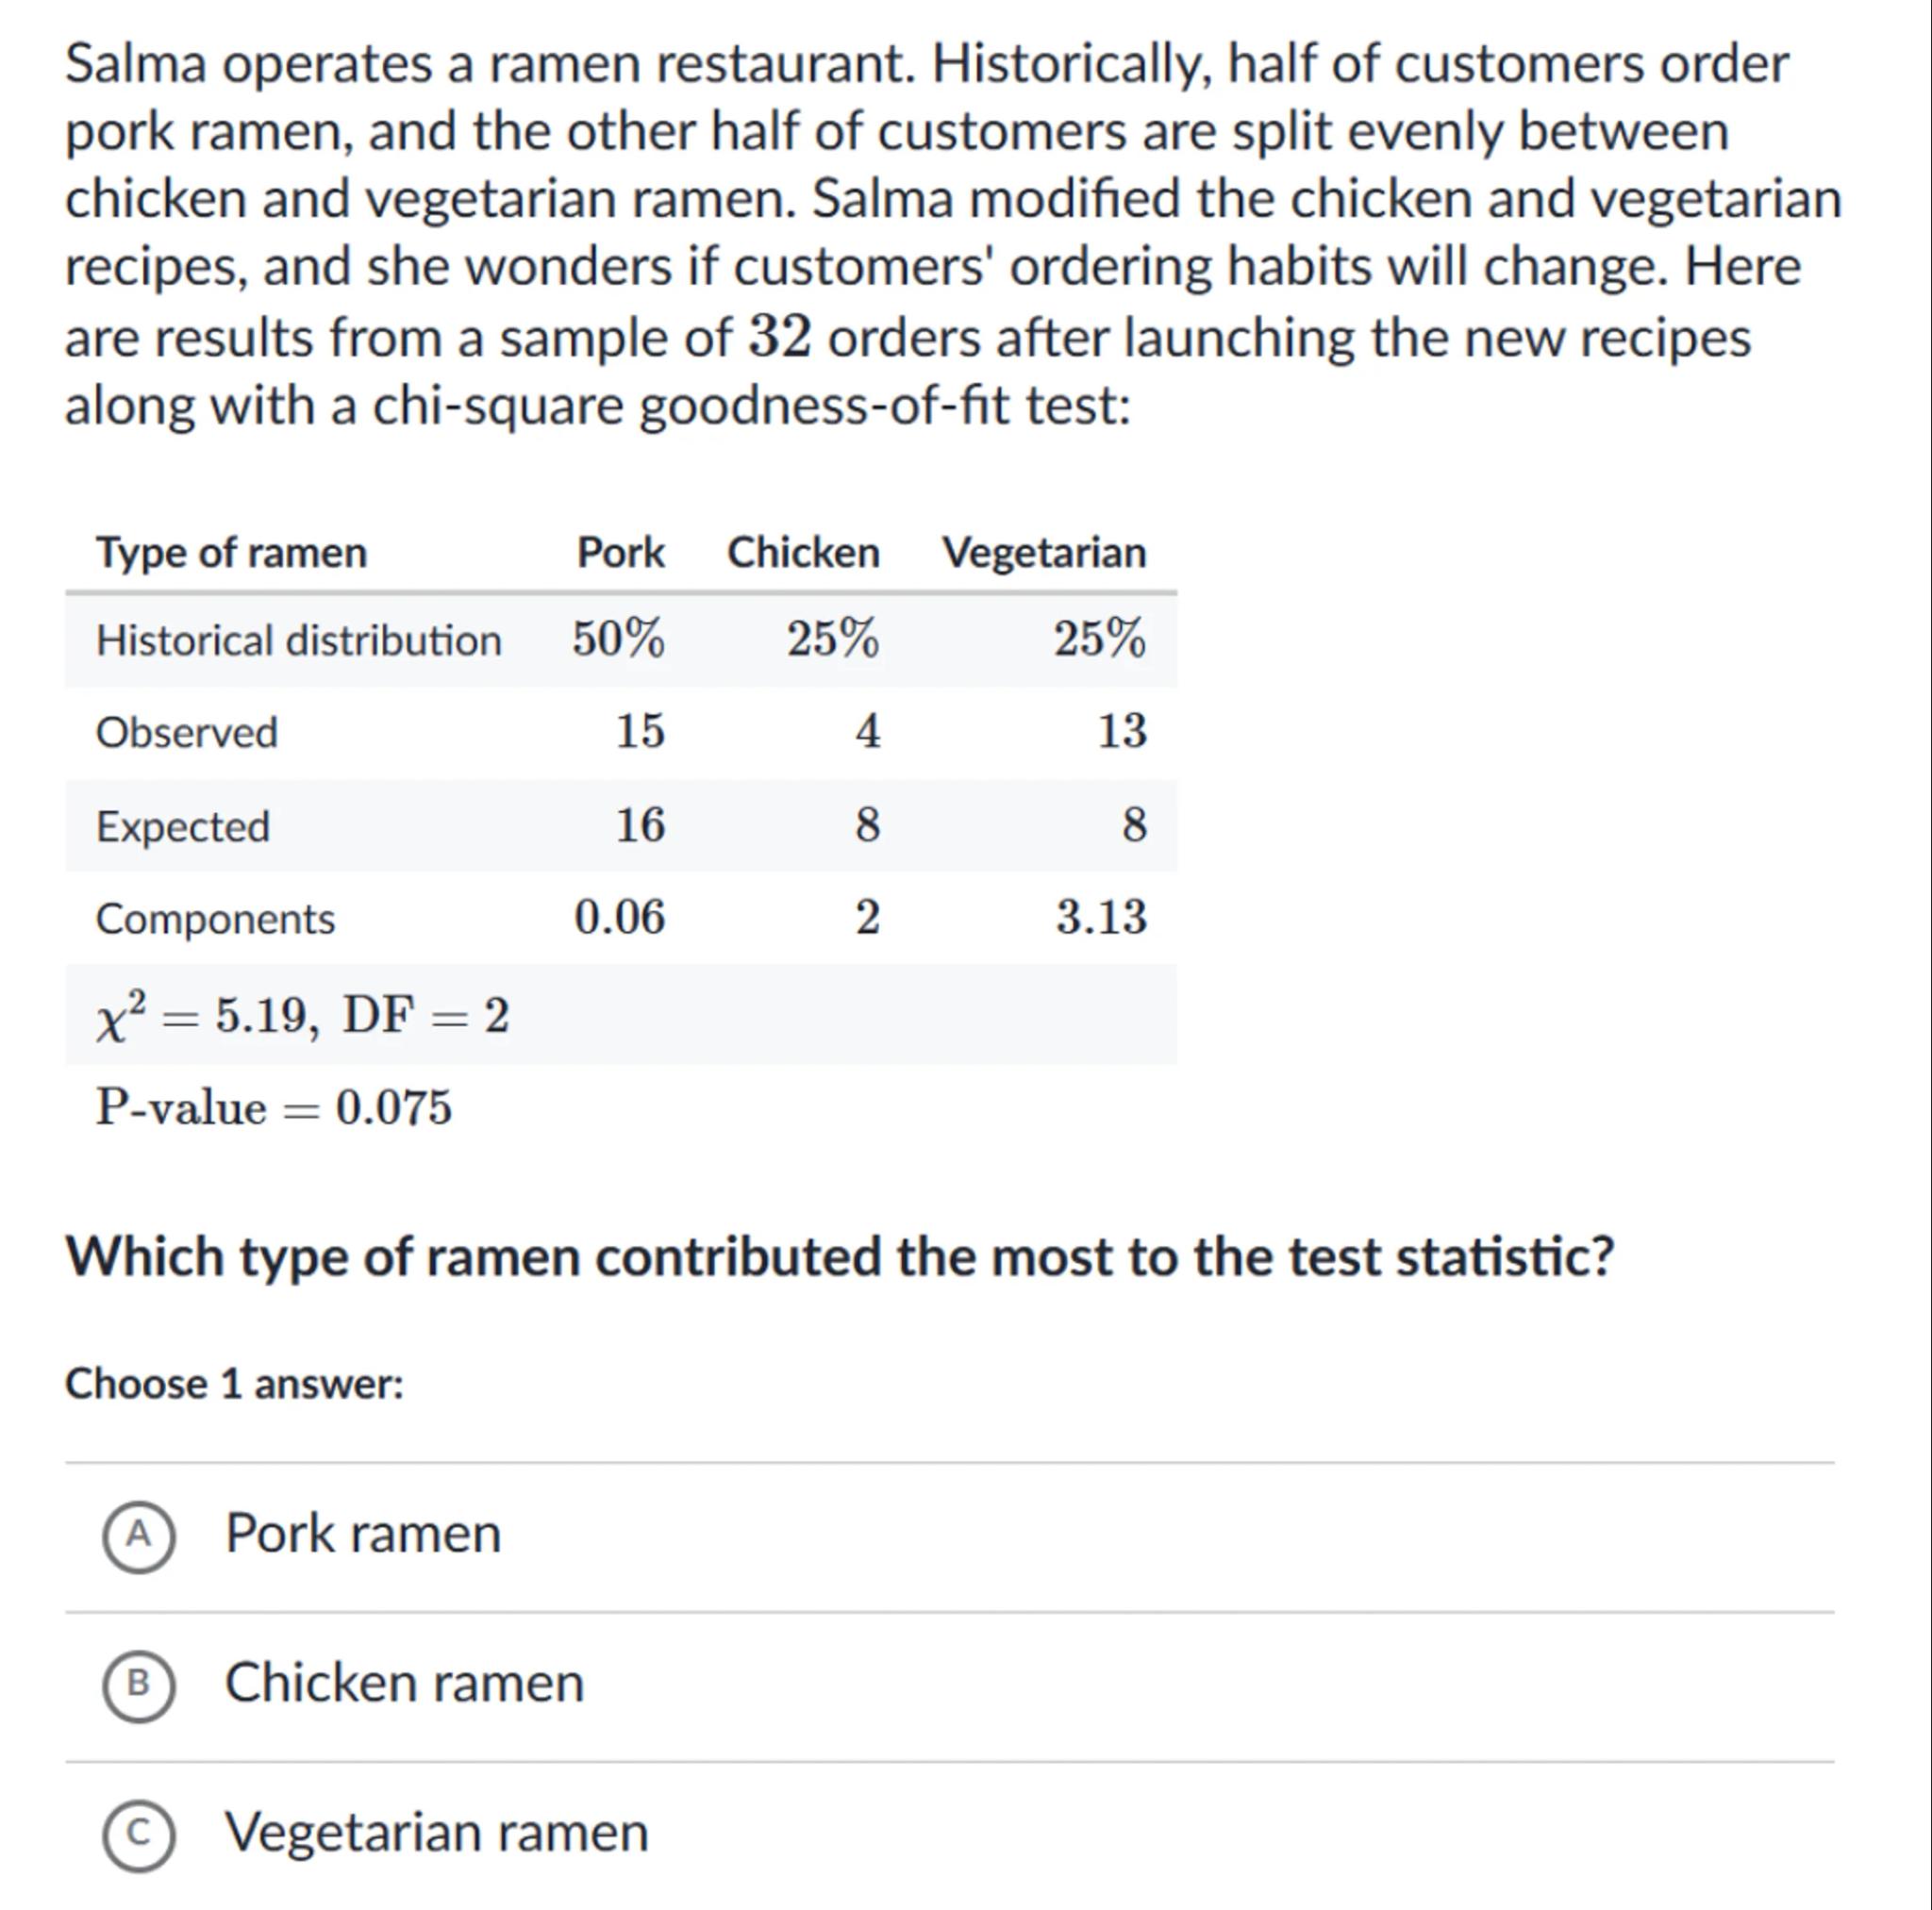
Salma operates a ramen restaurant. Historically, half of customers order pork ramen, and the other half of customers are split evenly between chicken and vegetarian ramen. Salma modified the chicken and vegetarian recipes, and she wonders if customers' ordering habits will change. Here are results from a sample of 32 orders after launching the new recipes along with a chi-square goodness-of-fit test:
\begin{tabular}{lrrr}
Type of ramen & Pork & Chicken & Vegetarian \\
\hline Historical distribution & & & \\
Observed & 15 & 4 & 13 \\
Expected & 16 & 8 & 8 \\
Components & 0.06 & 2 & 3.13
\end{tabular}
Which type of ramen contributed the most to the test statistic?
Choose 1 answer:
(A) Pork ramen
B) Chicken ramen
(C) Vegetarian ramen

Answer from Sia
Posted almost 2 years ago
Solution by Steps
step 2
The 'Components' values given are 0.06 for pork, 2 for chicken, and 3.13 for vegetarian
step 3
The type of ramen with the highest 'Components' value contributed the most to the chi-square test statistic
step 4
Vegetarian ramen has the highest 'Components' value of 3.13
step 5
Therefore, vegetarian ramen contributed the most to the chi-square test statistic
[question number] Answer
C
Key Concept
Chi-square test statistic contribution
Explanation
The type of ramen that contributes the most to the chi-square test statistic is the one with the highest 'Components' value in the chi-square table.
Not the question you are looking for? Ask here!
Enter question by text
Enter question by image
Unlock Smarter Learning with AskSia Super!
Join Super, our all-in-one AI solution that can greatly improve your learning efficiency.
30% higher accuracy than GPT-4o
Entire learning journey support
The most student-friendly features
Study Other Question