
AskSia

Question
Math
Posted about 2 years ago
Suppose that there is a probability that any given person in a population is left-handed, and a probability they are not left-handed.
Say we randomly select 2 people and categorize them as left-handed (L) or not (N). Here is a sample space showing the possible outcomes:
\begin{tabular}{|c|c|}
\hline person & person \\
\hline & \\
\hline & \\
\hline & \\
\hline L & L \\
\hline
\end{tabular}
Let represent the number of left-handed people in the pair.
Which table represents the theoretical probability distribution of ?
Choose 1 answer:
(A)
\begin{tabular}{c|c|c|c}
& 0 & 1 & 2 \\
\hline & 0.25 & 0.75 & 0.25
\end{tabular}
(B)
\begin{tabular}{c|c|c|c}
& 0 & 1 & 2 \\
\hline & 0.75 & 0.20 & 0.05
\end{tabular}
(C)
\begin{tabular}{c|c|c|c}
& 0 & 1 & 2 \\
\hline & 0.81 & 0.18 & 0.01
\end{tabular}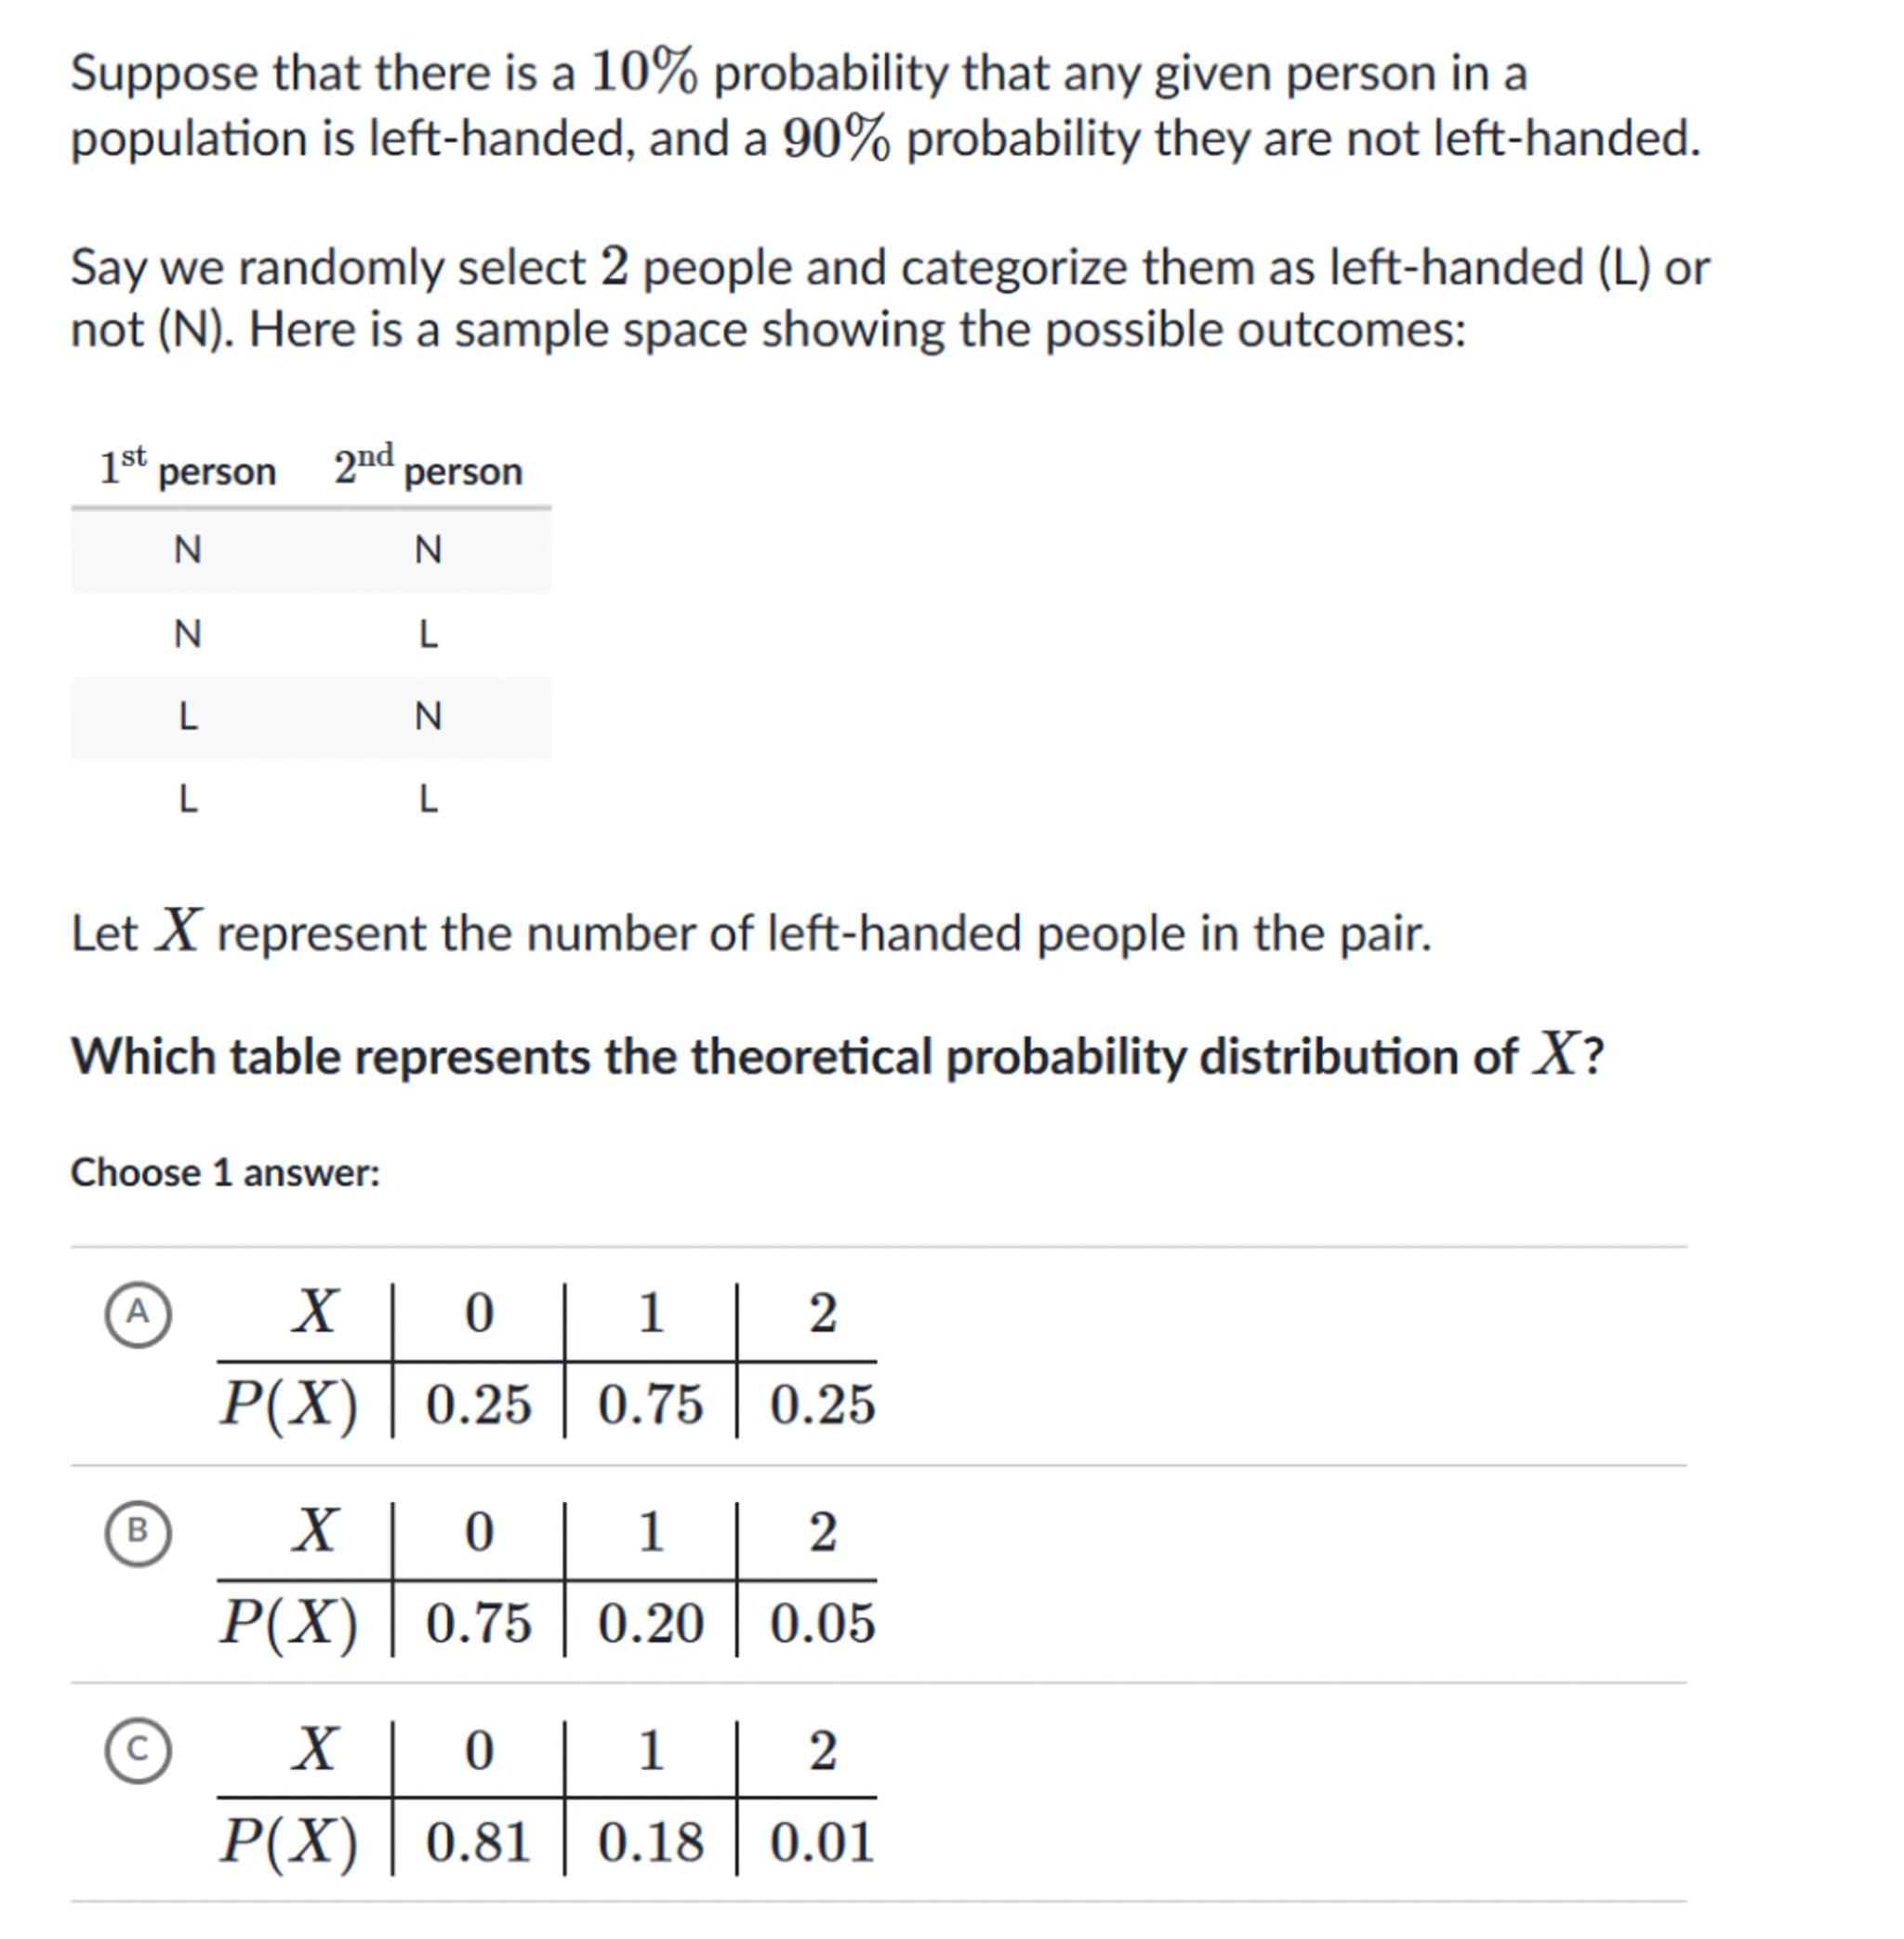
 Sign in to unlock the answer
Answer from Sia
Posted about 2 years ago
Solution by Steps
step 2
Calculate the probability of one person being left-handed and the other not (NL or LN). Since the probability of being left-handed is and not being left-handed is , for one of each it is
step 3
Calculate the probability of both people being left-handed (LL). Since the probability of one person being left-handed is , for two people it is
step 4
Assign the calculated probabilities to the correct values of . corresponds to NN, corresponds to NL or LN, and corresponds to LL
1 Answer
C
Key Concept
Theoretical Probability Distribution
Explanation
The theoretical probability distribution of a random variable is a list of the probabilities of each possible outcome. In this case, it's the distribution of the number of left-handed people in a pair.
Not the question you are looking for? Ask here!
Enter question by text
Enter question by image

Unlock Smarter Learning with AskSia Super!
Join Super, our all-in-one AI solution that can greatly improve your learning efficiency.
30% higher accuracy than GPT-4o
Entire learning journey support
The most student-friendly features

Study Other Question