
AskSia

Question
Math
Posted about 2 years ago
The dot plot shows the lengths of the tails of 15 duck-billed platypi.
Describe the distribution of the lengths.
Shape: The distribution of lengths is
Center: The median of the lengths is centimeters.
Spread: The range of the lengths is centimeters.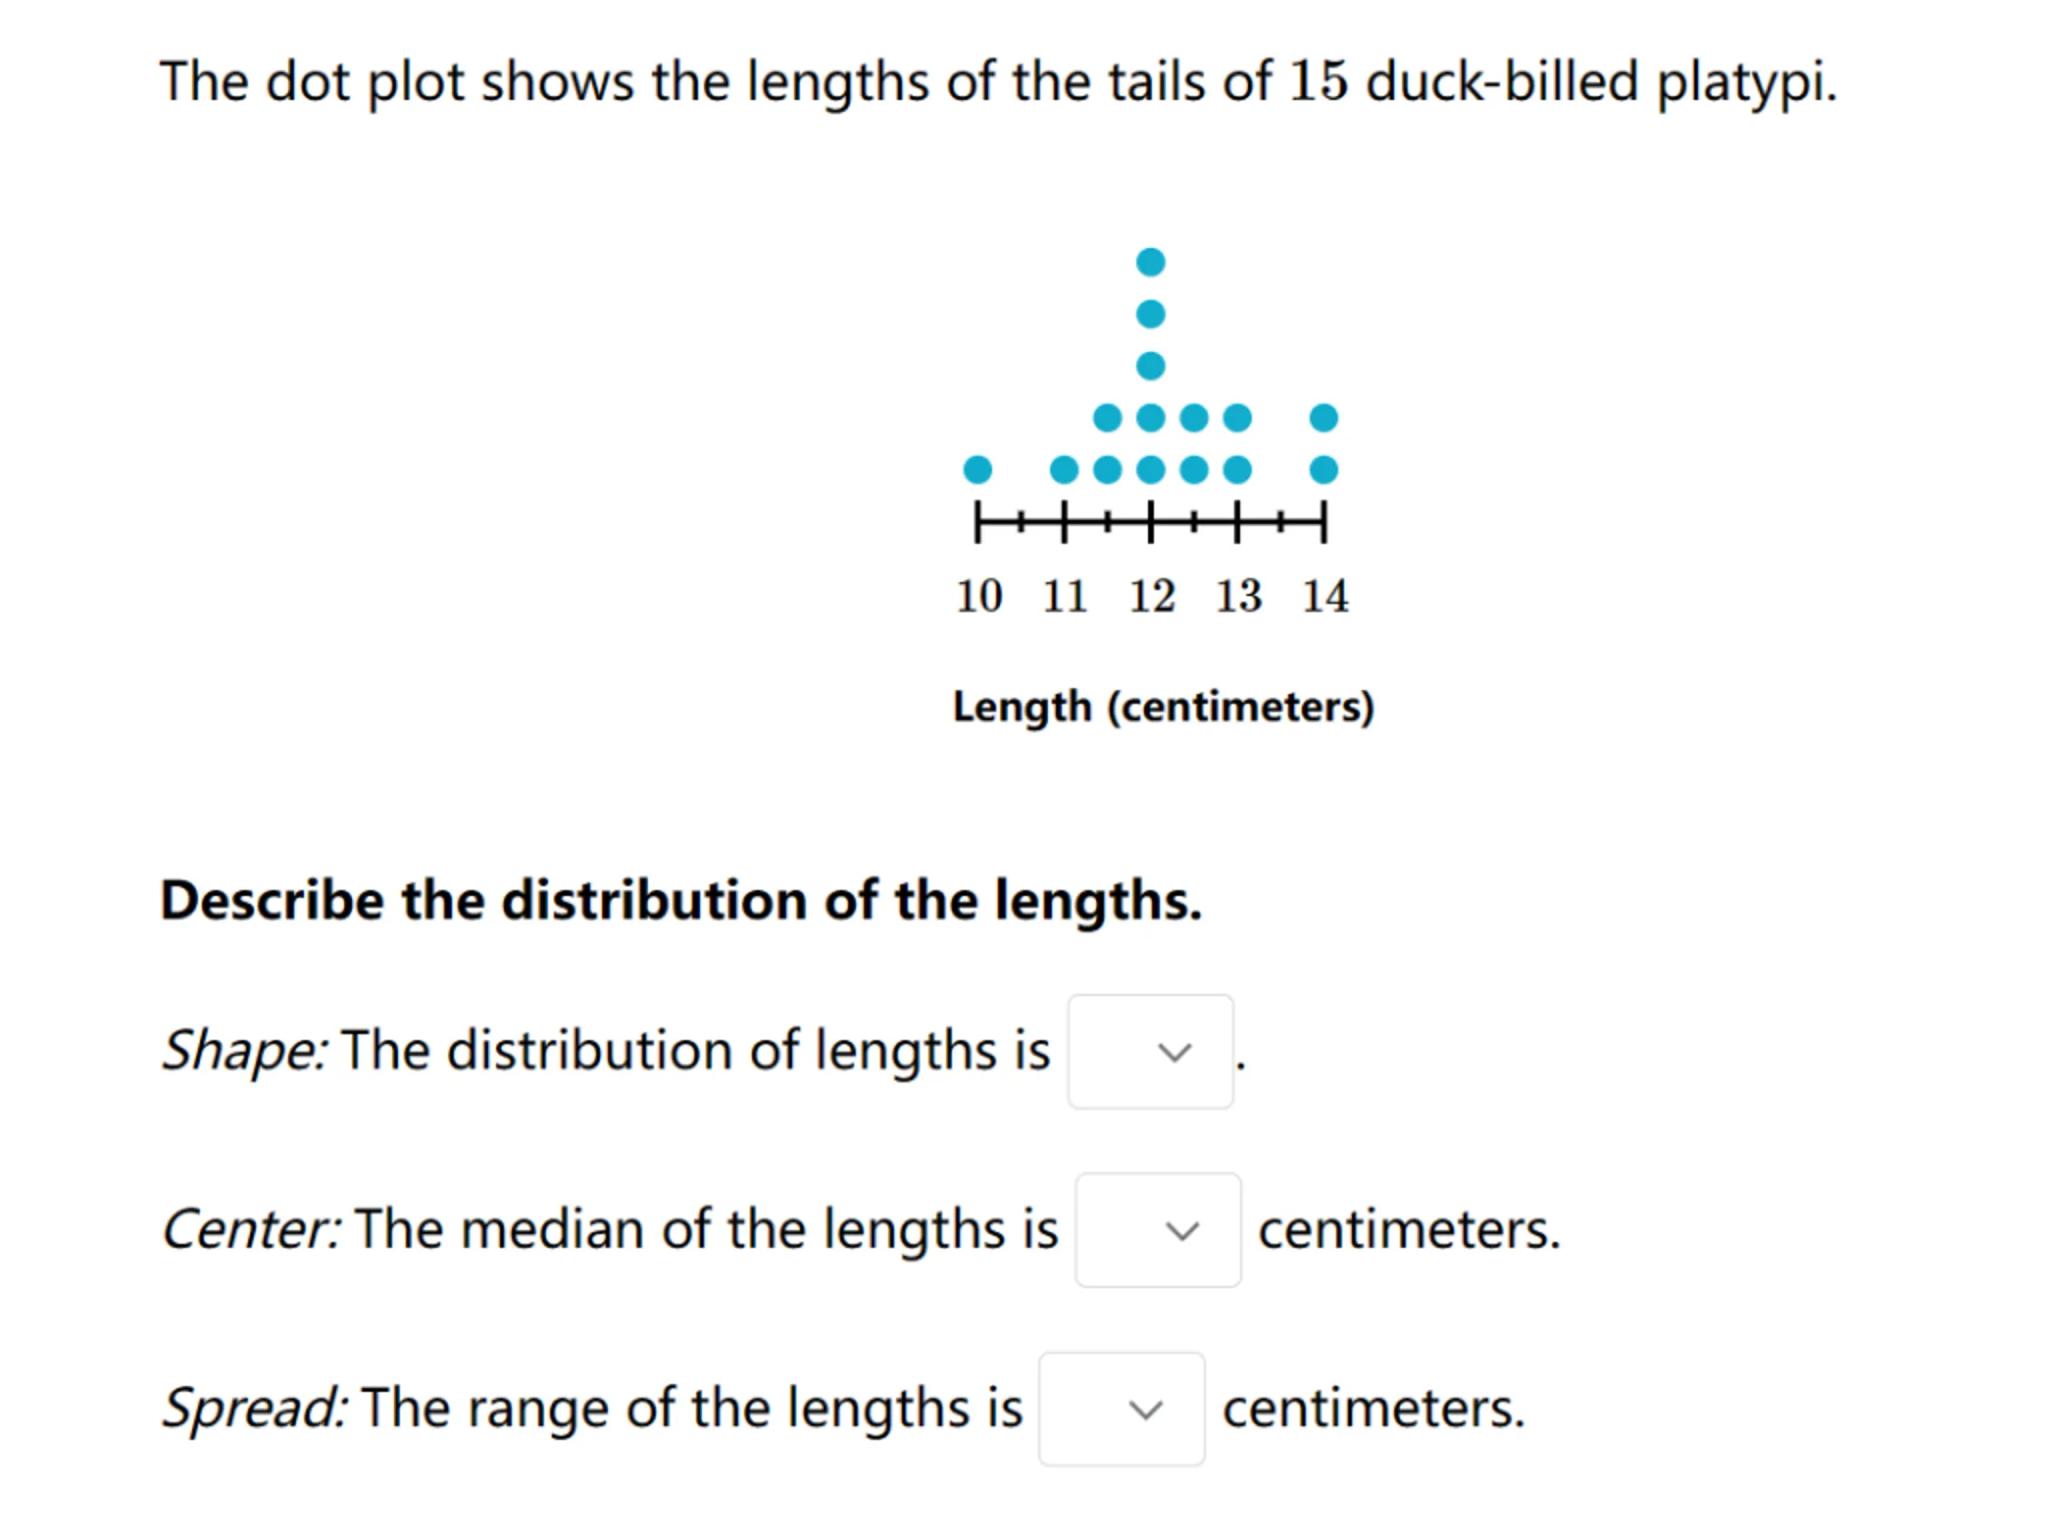
 Sign in to unlock the answer
Answer from Sia
Posted about 2 years ago
Solution by Steps
step 1
To describe the shape of the distribution, we look at the dot plot and observe where the data points are concentrated
step 2
The data points are concentrated around the 12 and 13-centimeter marks, indicating a central clustering
step 3
To find the center of the distribution, we calculate the median of the lengths
step 4
The median is the middle value when the data points are ordered from least to greatest
step 5
According to the asksia-ll calculator, the median of the given data set is centimeters
step 6
To determine the spread of the distribution, we calculate the range of the lengths
step 7
The range is the difference between the maximum and minimum values in the data set
step 8
According to the asksia-ll calculator, the range of the given data set is centimeters
[question 1] Answer
Shape: The distribution of lengths is centrally clustered around 12 and 13 centimeters.
Center: The median of the lengths is centimeters.
Spread: The range of the lengths is centimeters.
Key Concept
Describing a distribution involves discussing its shape, center, and spread.
Explanation
The shape is observed from the concentration of data points, the center is determined by the median, and the spread is calculated as the range of the data set.
Not the question you are looking for? Ask here!
Enter question by text
Enter question by image

Unlock Smarter Learning with AskSia Super!
Join Super, our all-in-one AI solution that can greatly improve your learning efficiency.
30% higher accuracy than GPT-4o
Entire learning journey support
The most student-friendly features

Study Other Question