
AskSia

Question
Microeconomics
Posted about 2 years ago
The figure shown here illustrates the short-run average total cost (SRATC) curves for a firm.

Which of the following best describes what the SRATC curves shown here collectively illustrates

Choose 1 answer:
(A) A firm's total costs of producing at different scales of production
(B) a firm's hypothetical short-run cost curves for different levels of fixed costs
(c) a firm with average fixed costs that decline as output increases
(D) a firm with diminishing returns to inputs
(E) A firm's output per unit of input used, given that at least one type of input is fixed.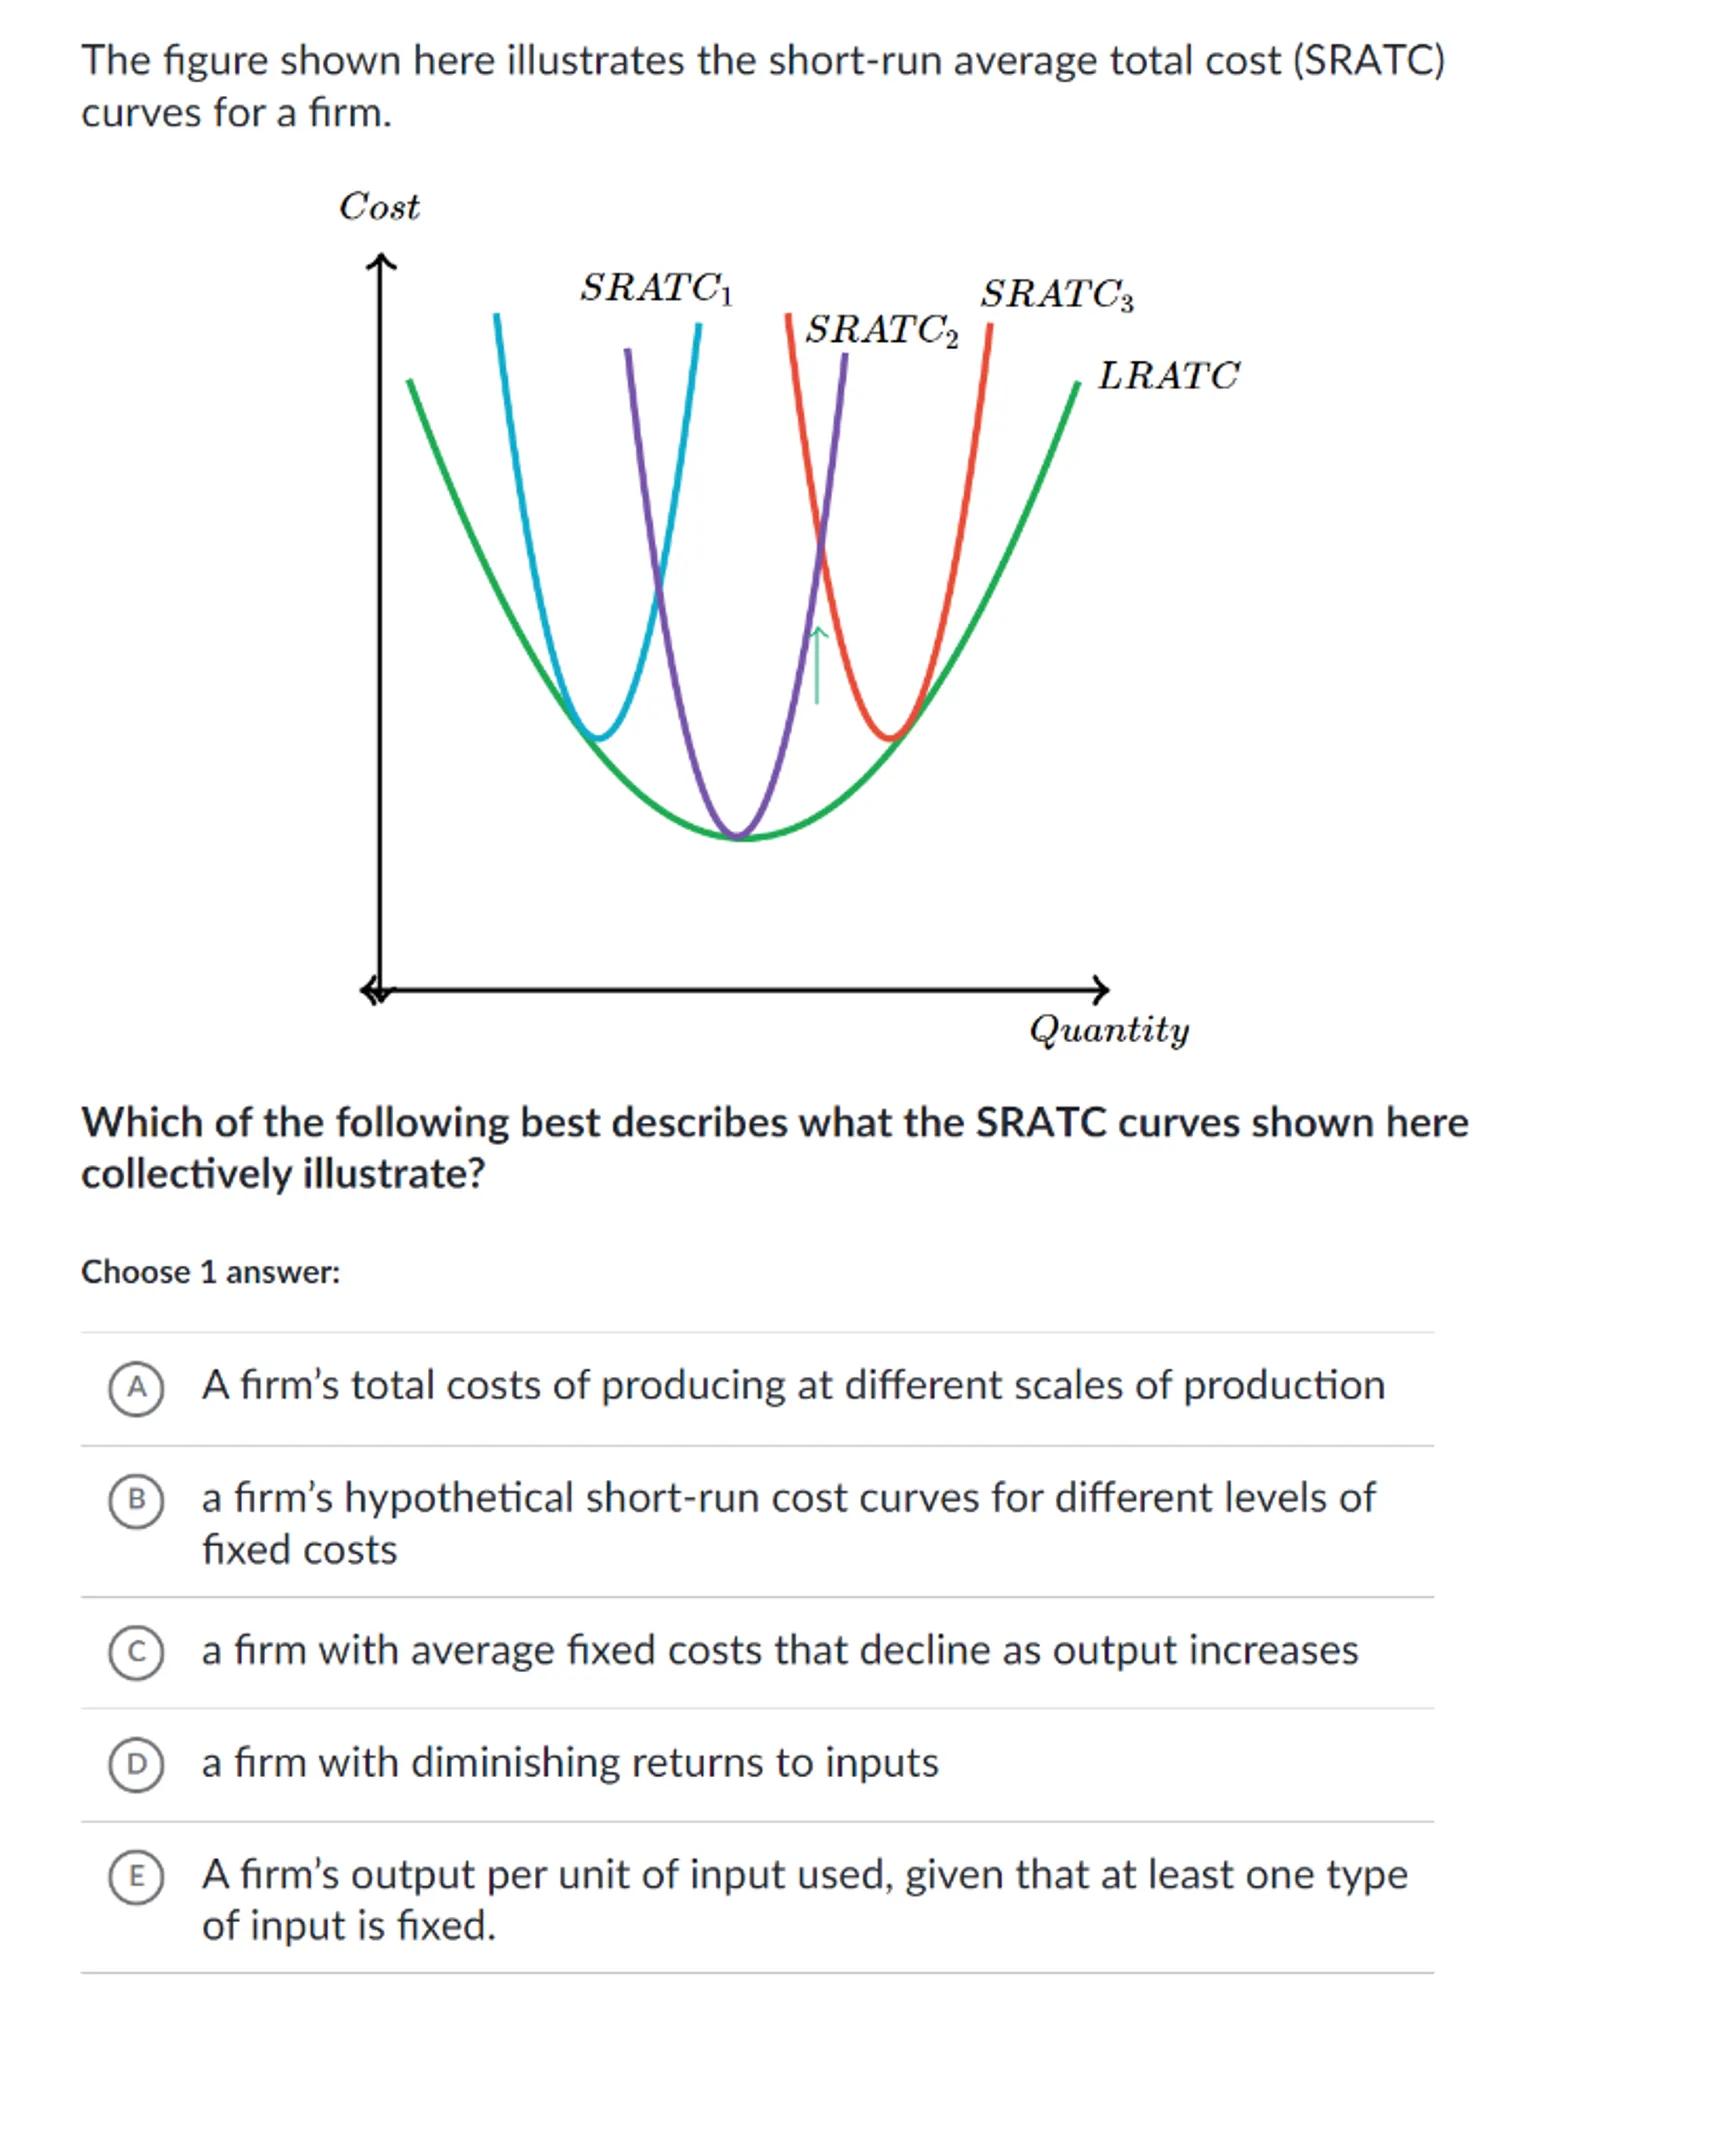
 Sign in to unlock the answer
Answer from Sia
Posted about 2 years ago
Sure, let's analyze the given question about the short-run average total cost (SRATC) curves and determine the correct answer.
Solution
a
Definition of SRATC: The short-run average total cost (SRATC) curve represents the average total cost of production when at least one input is fixed
b
Tangency Point: The long-run average total cost (LRATC) curve is tangent to the minimum points of the SRATC curves, indicating the lowest possible cost at each level of output when all inputs are variable
c
Diminishing Returns: The U-shaped nature of the SRATC curves suggests that initially, as production increases, average total costs decrease due to increasing returns to scale. However, after a certain point, average total costs start to increase due to diminishing returns to inputs
Answer
(D) a firm with diminishing returns to inputs
Key Concept
Diminishing Returns to Inputs
Explanation
The SRATC curves collectively illustrate a firm experiencing diminishing returns to inputs, as indicated by the U-shaped curves. Initially, costs decrease with increased production, but after a certain point, costs increase due to diminishing returns.
Not the question you are looking for? Ask here!
Enter question by text
Enter question by image

Unlock Smarter Learning with AskSia Super!
Join Super, our all-in-one AI solution that can greatly improve your learning efficiency.
30% higher accuracy than GPT-4o
Entire learning journey support
The most student-friendly features

Study Other Question