Sia

Question
Math
Posted over 1 year ago
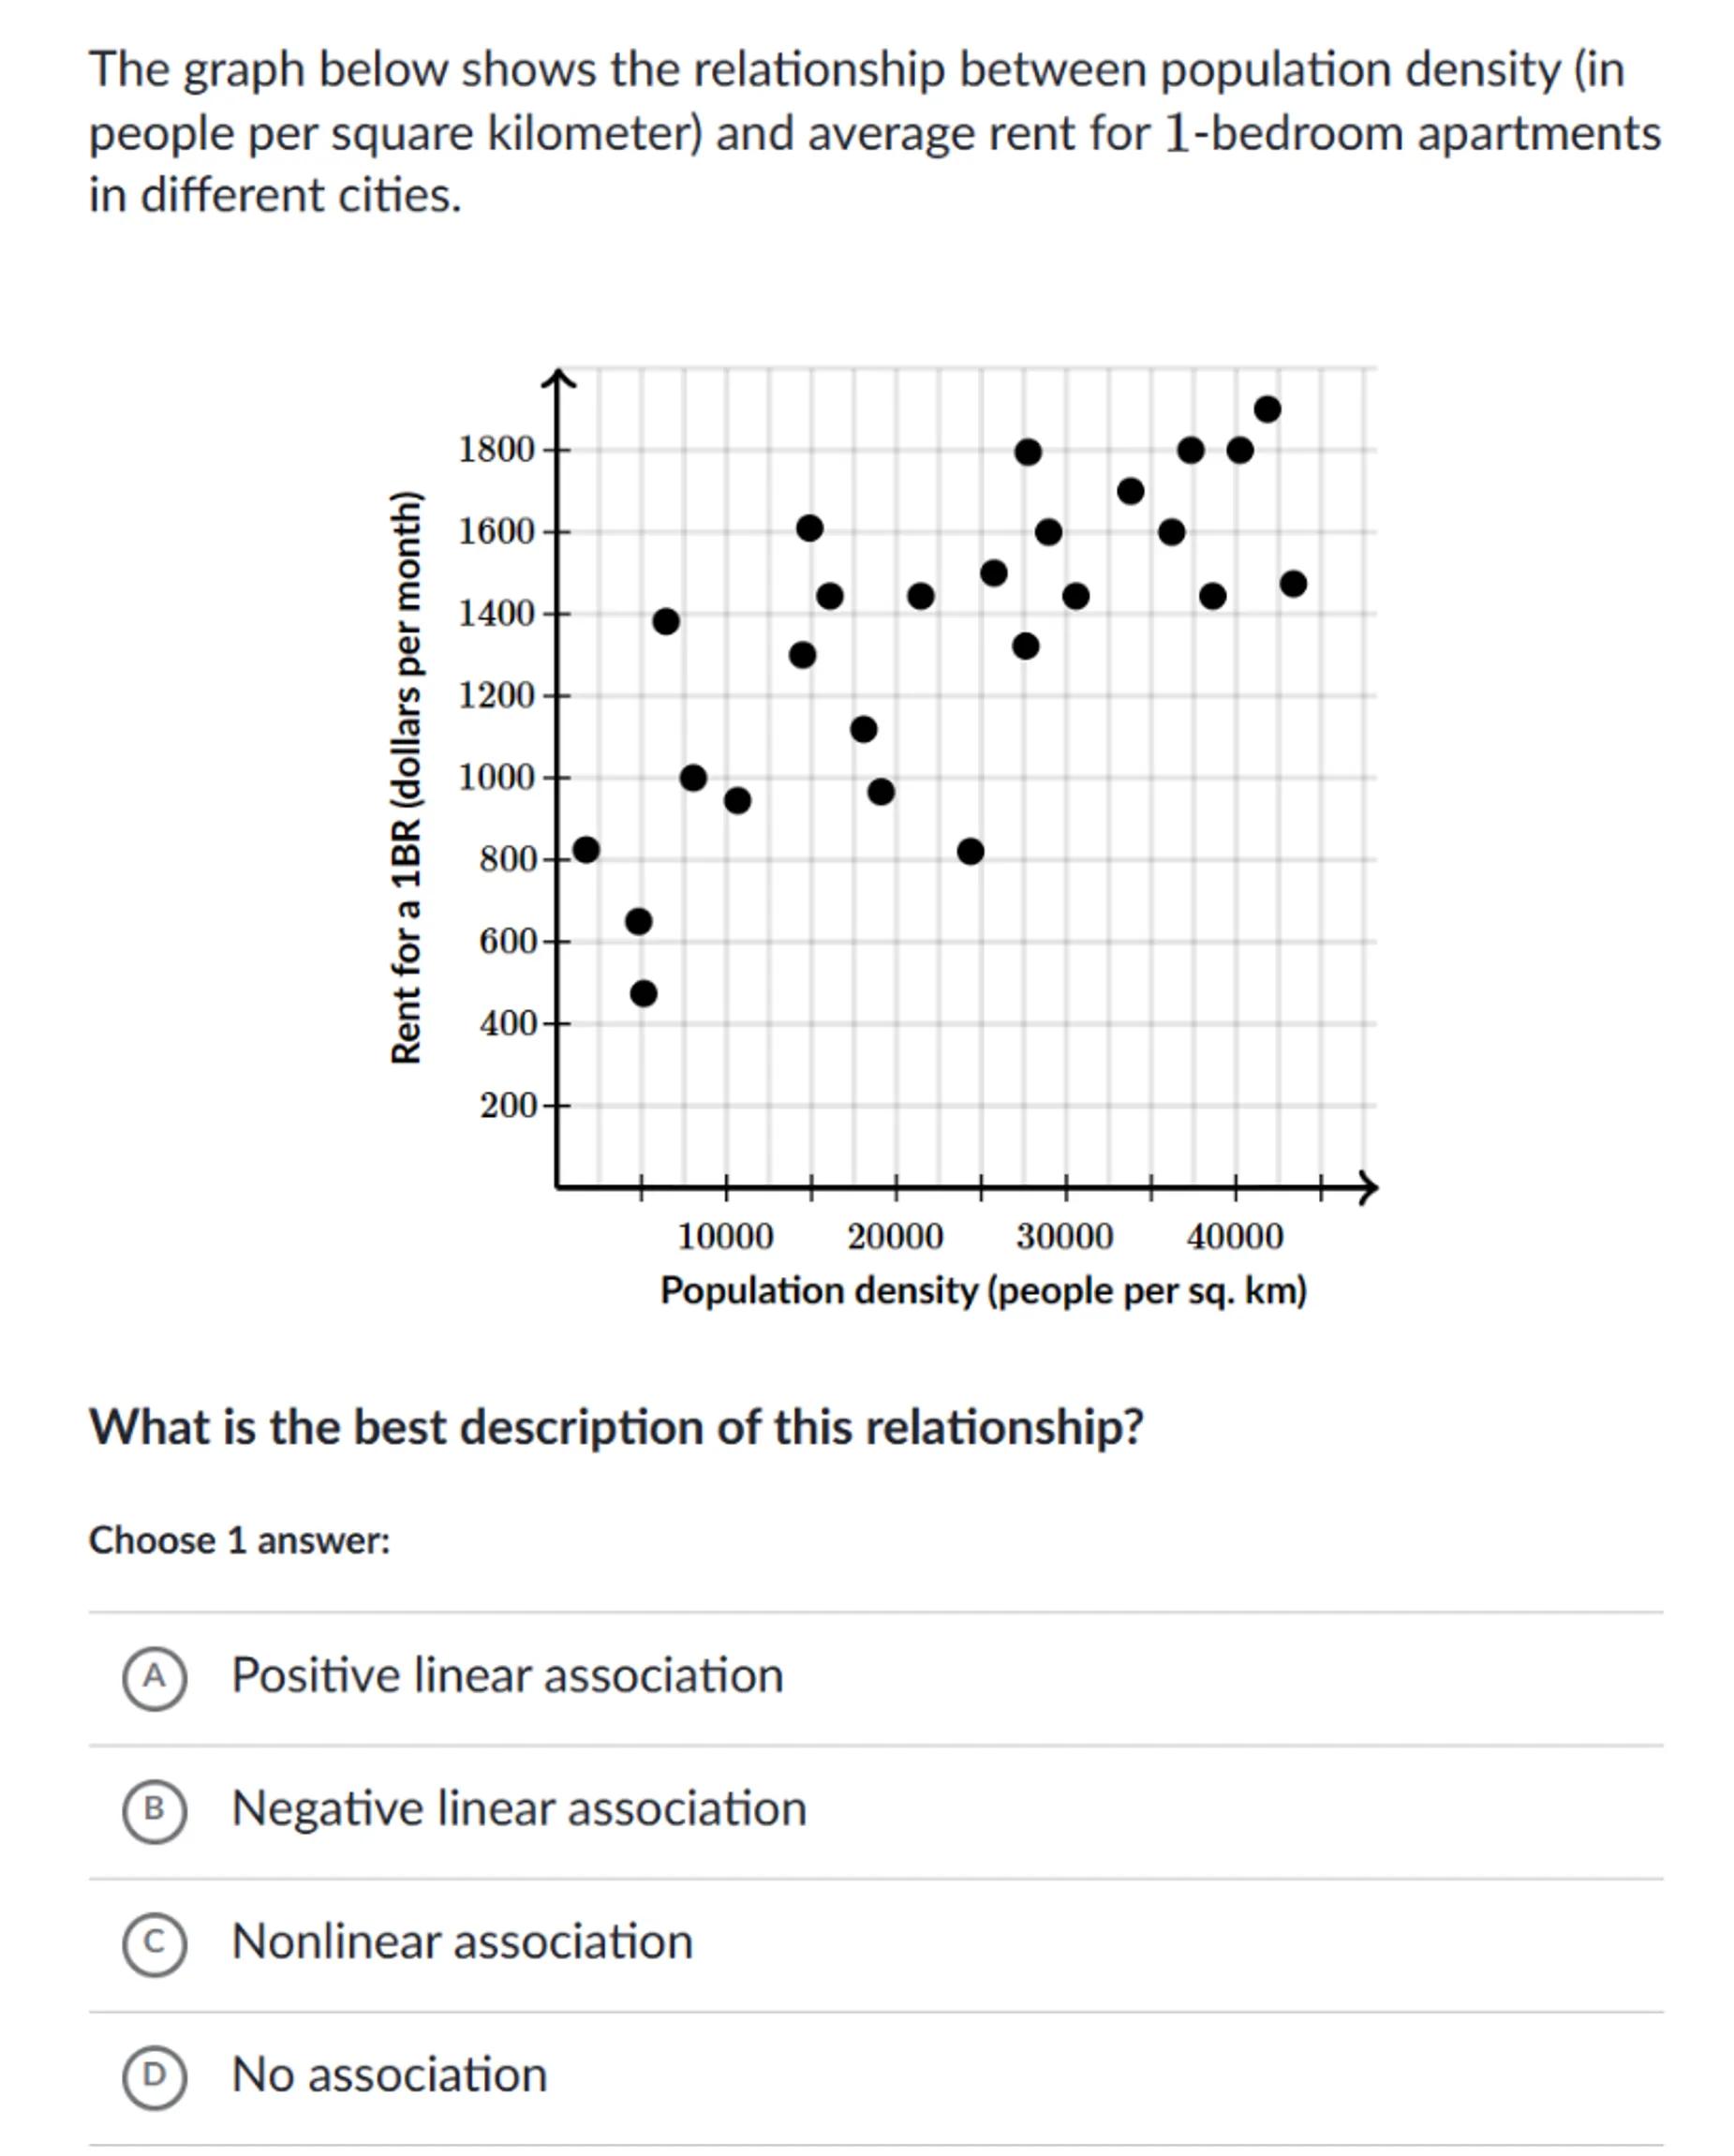
The graph below shows the relationship between population density (in people per square kilometer) and average rent for 1-bedroom apartments in different cities.

What is the best description of this relationship?
Choose 1 answer:
(A) Positive linear association
(B) Negative linear association
(C) Nonlinear association
(D) No association

Answer from Sia
Posted over 1 year ago
Solution by Steps
step 2
If the points tend to go upwards from left to right, this indicates a positive association
step 3
If the points tend to go downwards from left to right, this indicates a negative association
step 4
If the points show a curved pattern, this indicates a nonlinear association
step 5
If the points are scattered randomly with no discernible pattern, this indicates no association
step 6
Based on the description provided, as population density increases, the rent for a one-bedroom apartment also tends to increase, suggesting a positive linear association
[question number] Answer
A
Key Concept
Scatter Plot Association
Explanation
A scatter plot displays the relationship between two variables. The pattern of the points indicates the type of association: positive linear, negative linear, nonlinear, or no association.
Not the question you are looking for? Ask here!
Enter question by text
Enter question by image
Unlock Smarter Learning with AskSia Super!
Join Super, our all-in-one AI solution that can greatly improve your learning efficiency.
30% higher accuracy than GPT-4o
Entire learning journey support
The most student-friendly features
Study Other Question