Sia

Question
Math
Posted almost 2 years ago
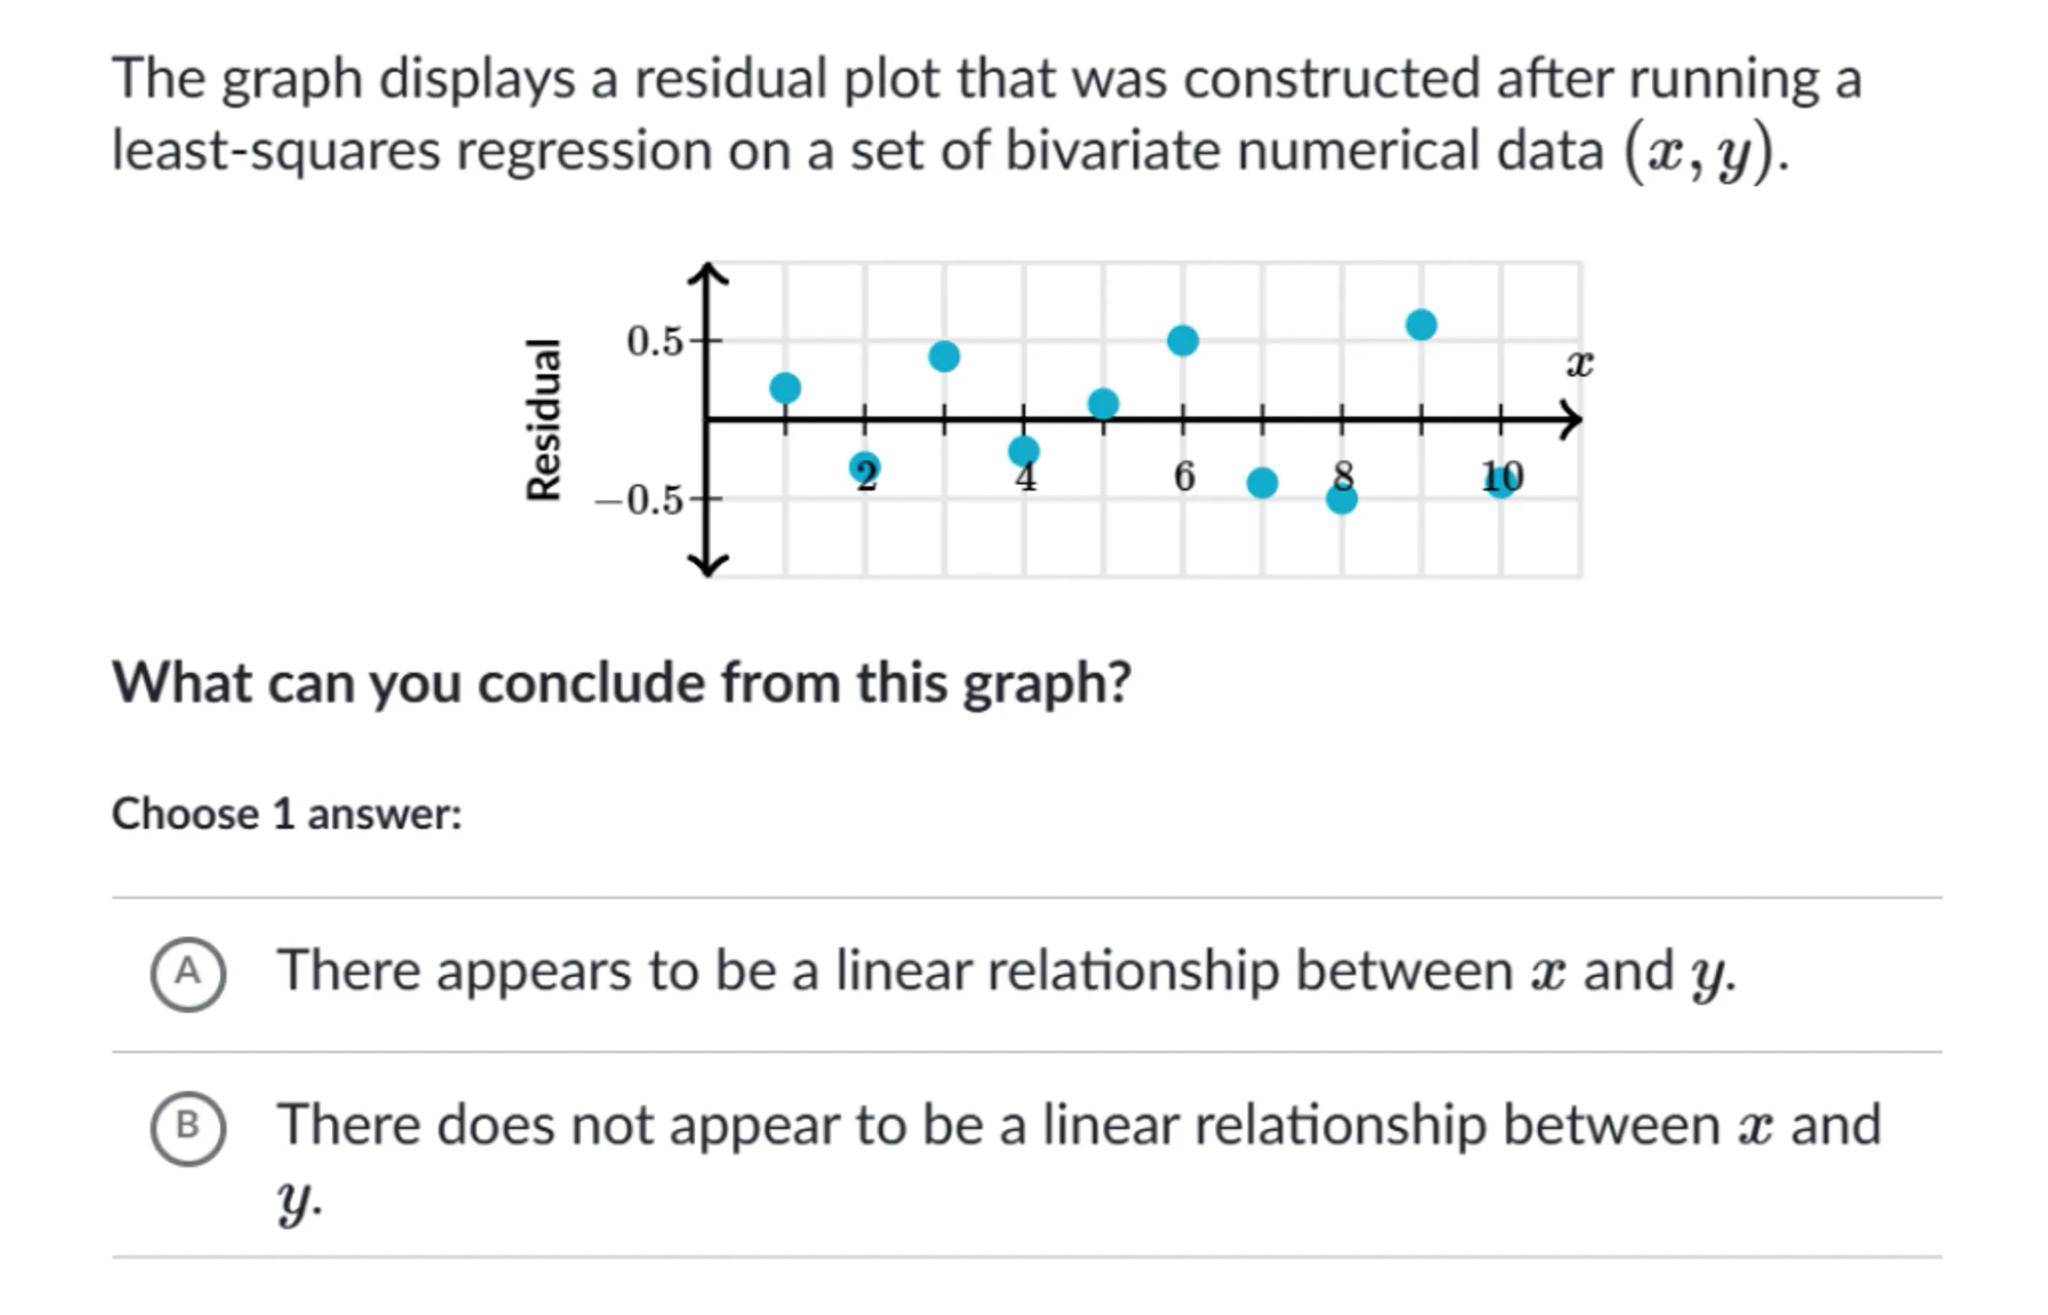
The graph displays a residual plot that was constructed after running a least-squares regression on a set of bivariate numerical data .
What can you conclude from this graph?
Choose 1 answer:
(A) There appears to be a linear relationship between and .
(B) There does not appear to be a linear relationship between and .

Answer from Sia
Posted almost 2 years ago
Solution by Steps
step 2
If the residuals are randomly scattered around the horizontal axis (y = 0), this suggests that the linear model is appropriate for the data
step 3
The absence of patterns or systematic structures in the scatter plot of residuals indicates that there is no violation of the assumption of linearity
step 4
Since the question states that the distribution of the points appears to be relatively random with no clear pattern, it suggests that the linear model fits the data well
A
Key Concept
Residual Plot Analysis
Explanation
A residual plot with randomly scattered residuals around the horizontal axis suggests a good fit for a linear regression model, indicating a linear relationship between the independent and dependent variables.
Not the question you are looking for? Ask here!
Enter question by text
Enter question by image
Unlock Smarter Learning with AskSia Super!
Join Super, our all-in-one AI solution that can greatly improve your learning efficiency.
30% higher accuracy than GPT-4o
Entire learning journey support
The most student-friendly features
Study Other Question