Sia

Question
Statistics
Posted almost 2 years ago
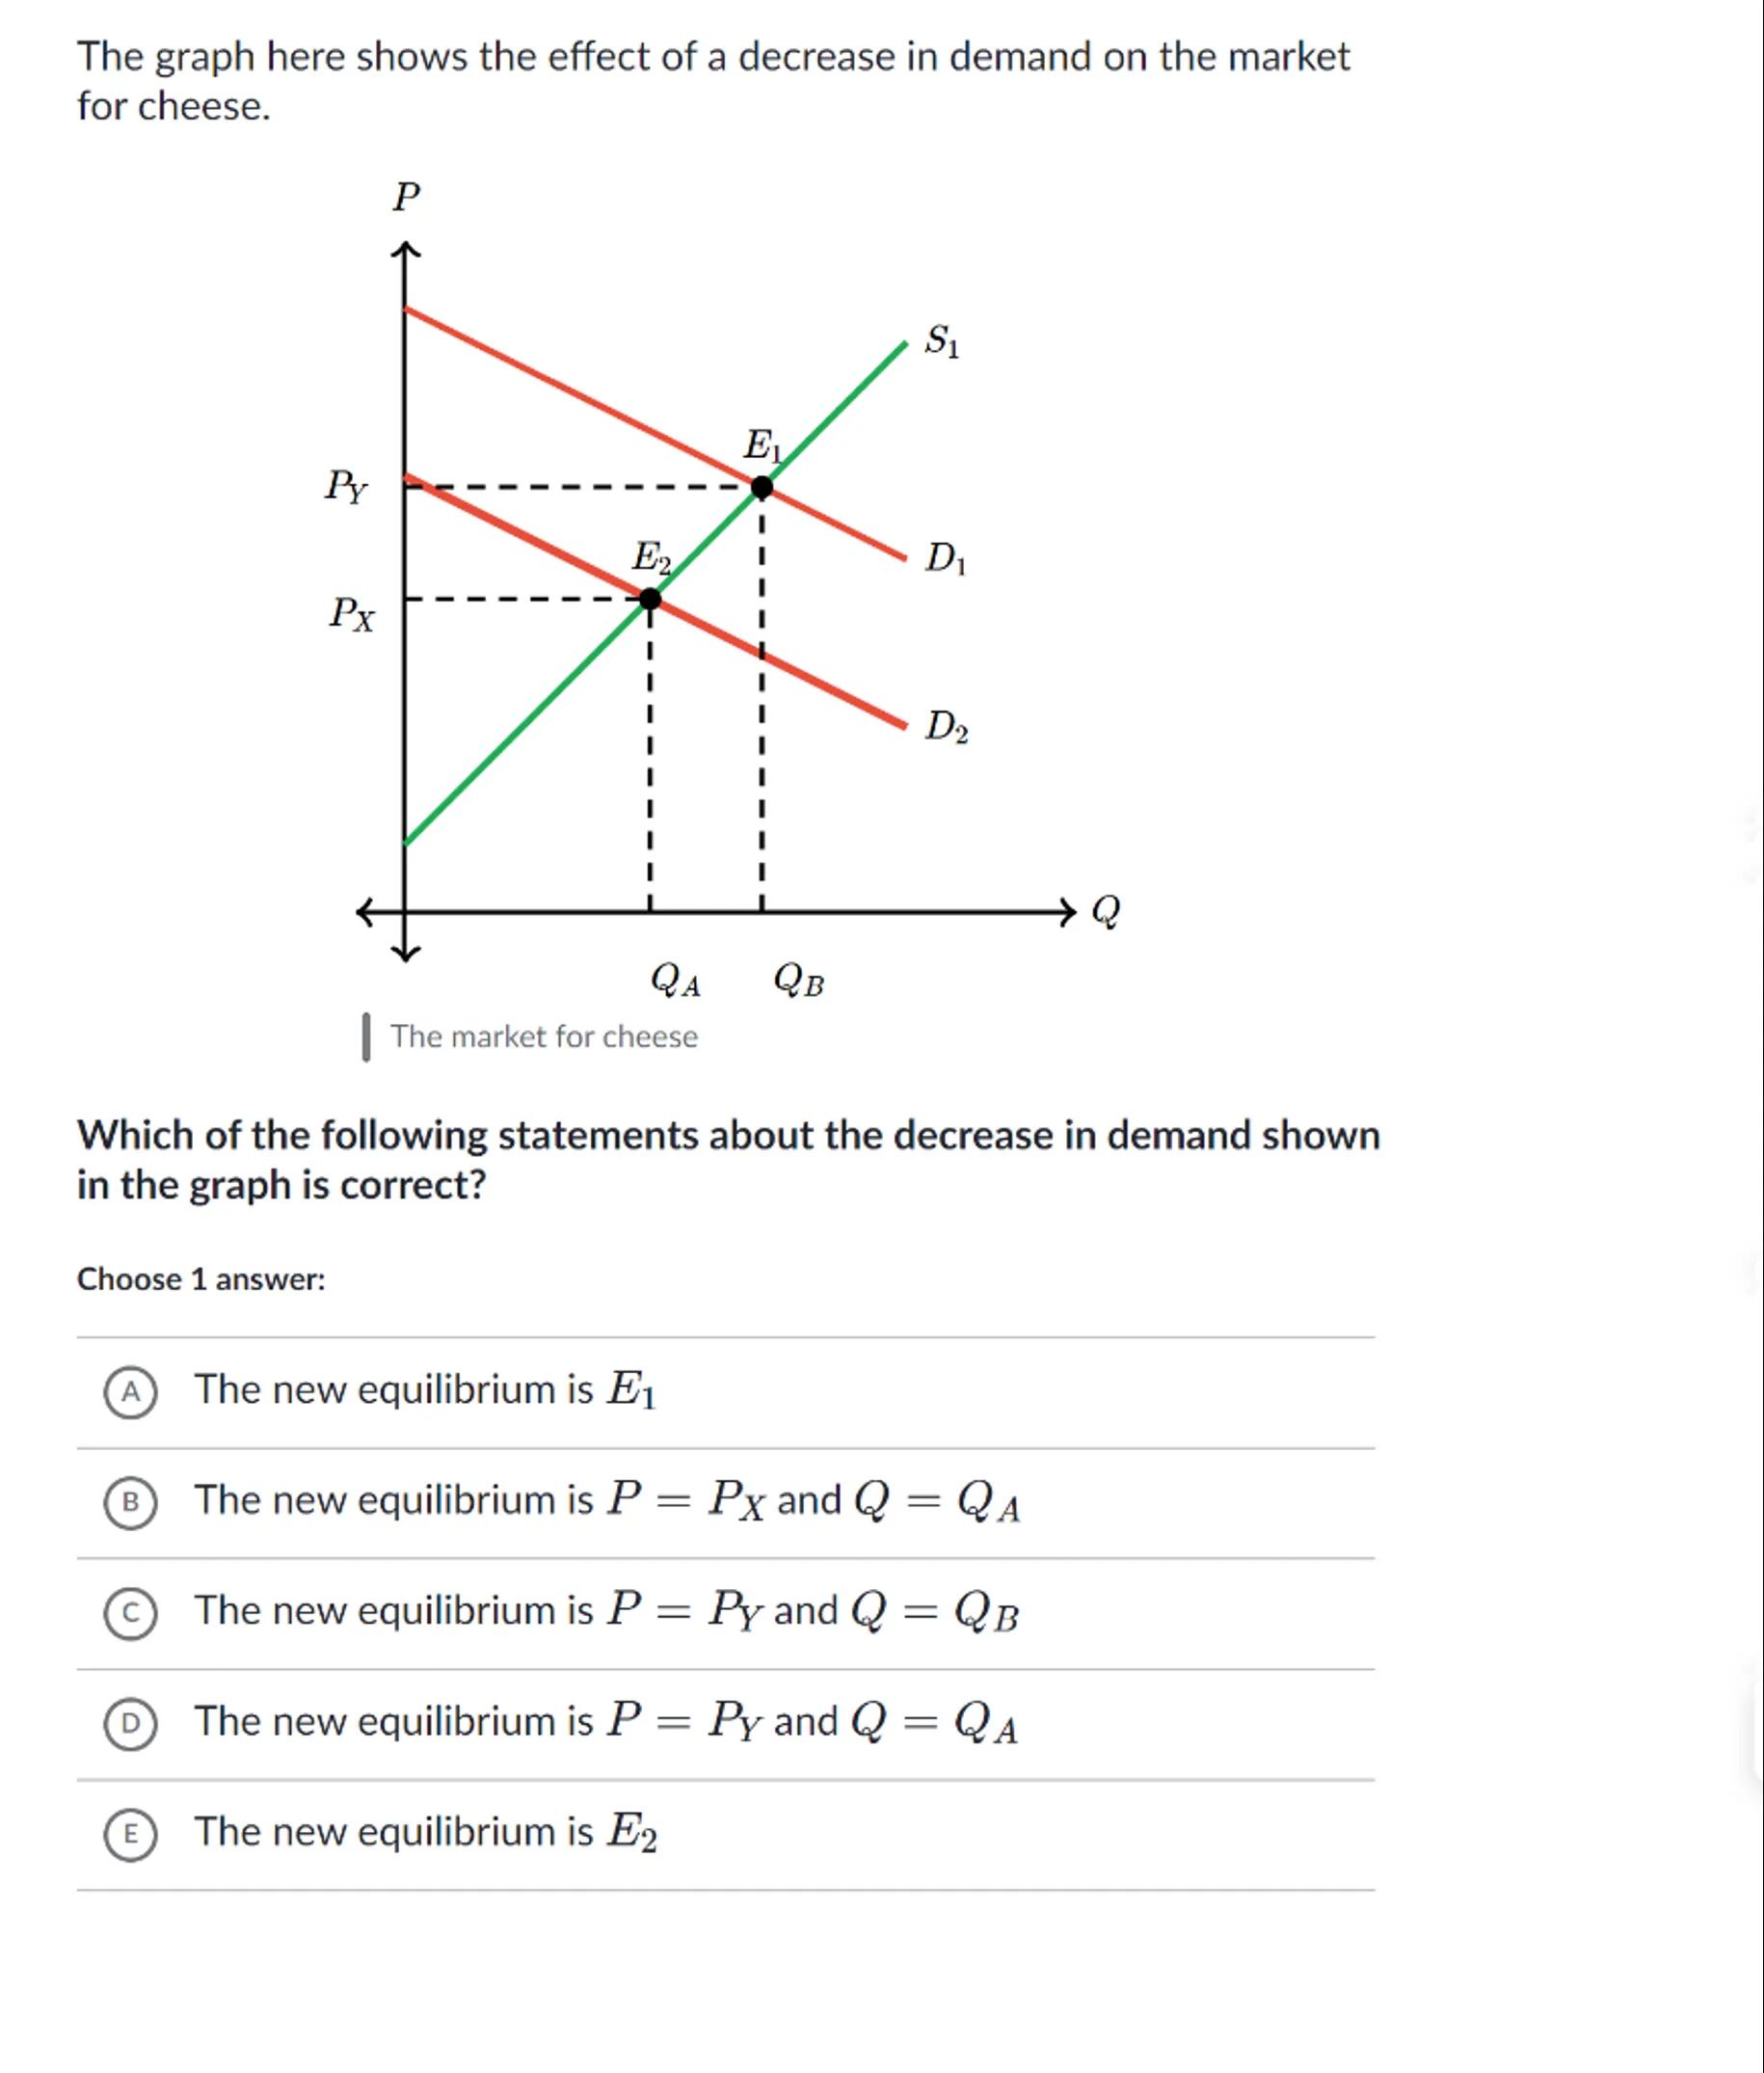
The graph here shows the effect of a decrease in demand on the market for cheese.
The market for cheese
Which of the following statements about the decrease in demand shown in the graph is correct?
Choose 1 answer:
(A) The new equilibrium is
(B) The new equilibrium is and
(C) The new equilibrium is and
(D) The new equilibrium is and
(E) The new equilibrium is 

Answer from Sia
Posted almost 2 years ago
Solution by Steps
step 1
Identify the initial equilibrium point on the graph: The initial equilibrium point is where the original demand curve intersects with the supply curve , which is at point
step 2
Determine the new equilibrium point after the decrease in demand: The new equilibrium point is where the new demand curve intersects with the supply curve , which is at point
step 3
Match the new equilibrium point to the answer choices: Point corresponds to a new price level and a new quantity level
Answer
C
Key Concept
Equilibrium Point After Decrease in Demand
Explanation
The new equilibrium point after a decrease in demand is where the new demand curve intersects with the supply curve.
Not the question you are looking for? Ask here!
Enter question by text
Enter question by image
Unlock Smarter Learning with AskSia Super!
Join Super, our all-in-one AI solution that can greatly improve your learning efficiency.
30% higher accuracy than GPT-4o
Entire learning journey support
The most student-friendly features
Study Other Question