Sia
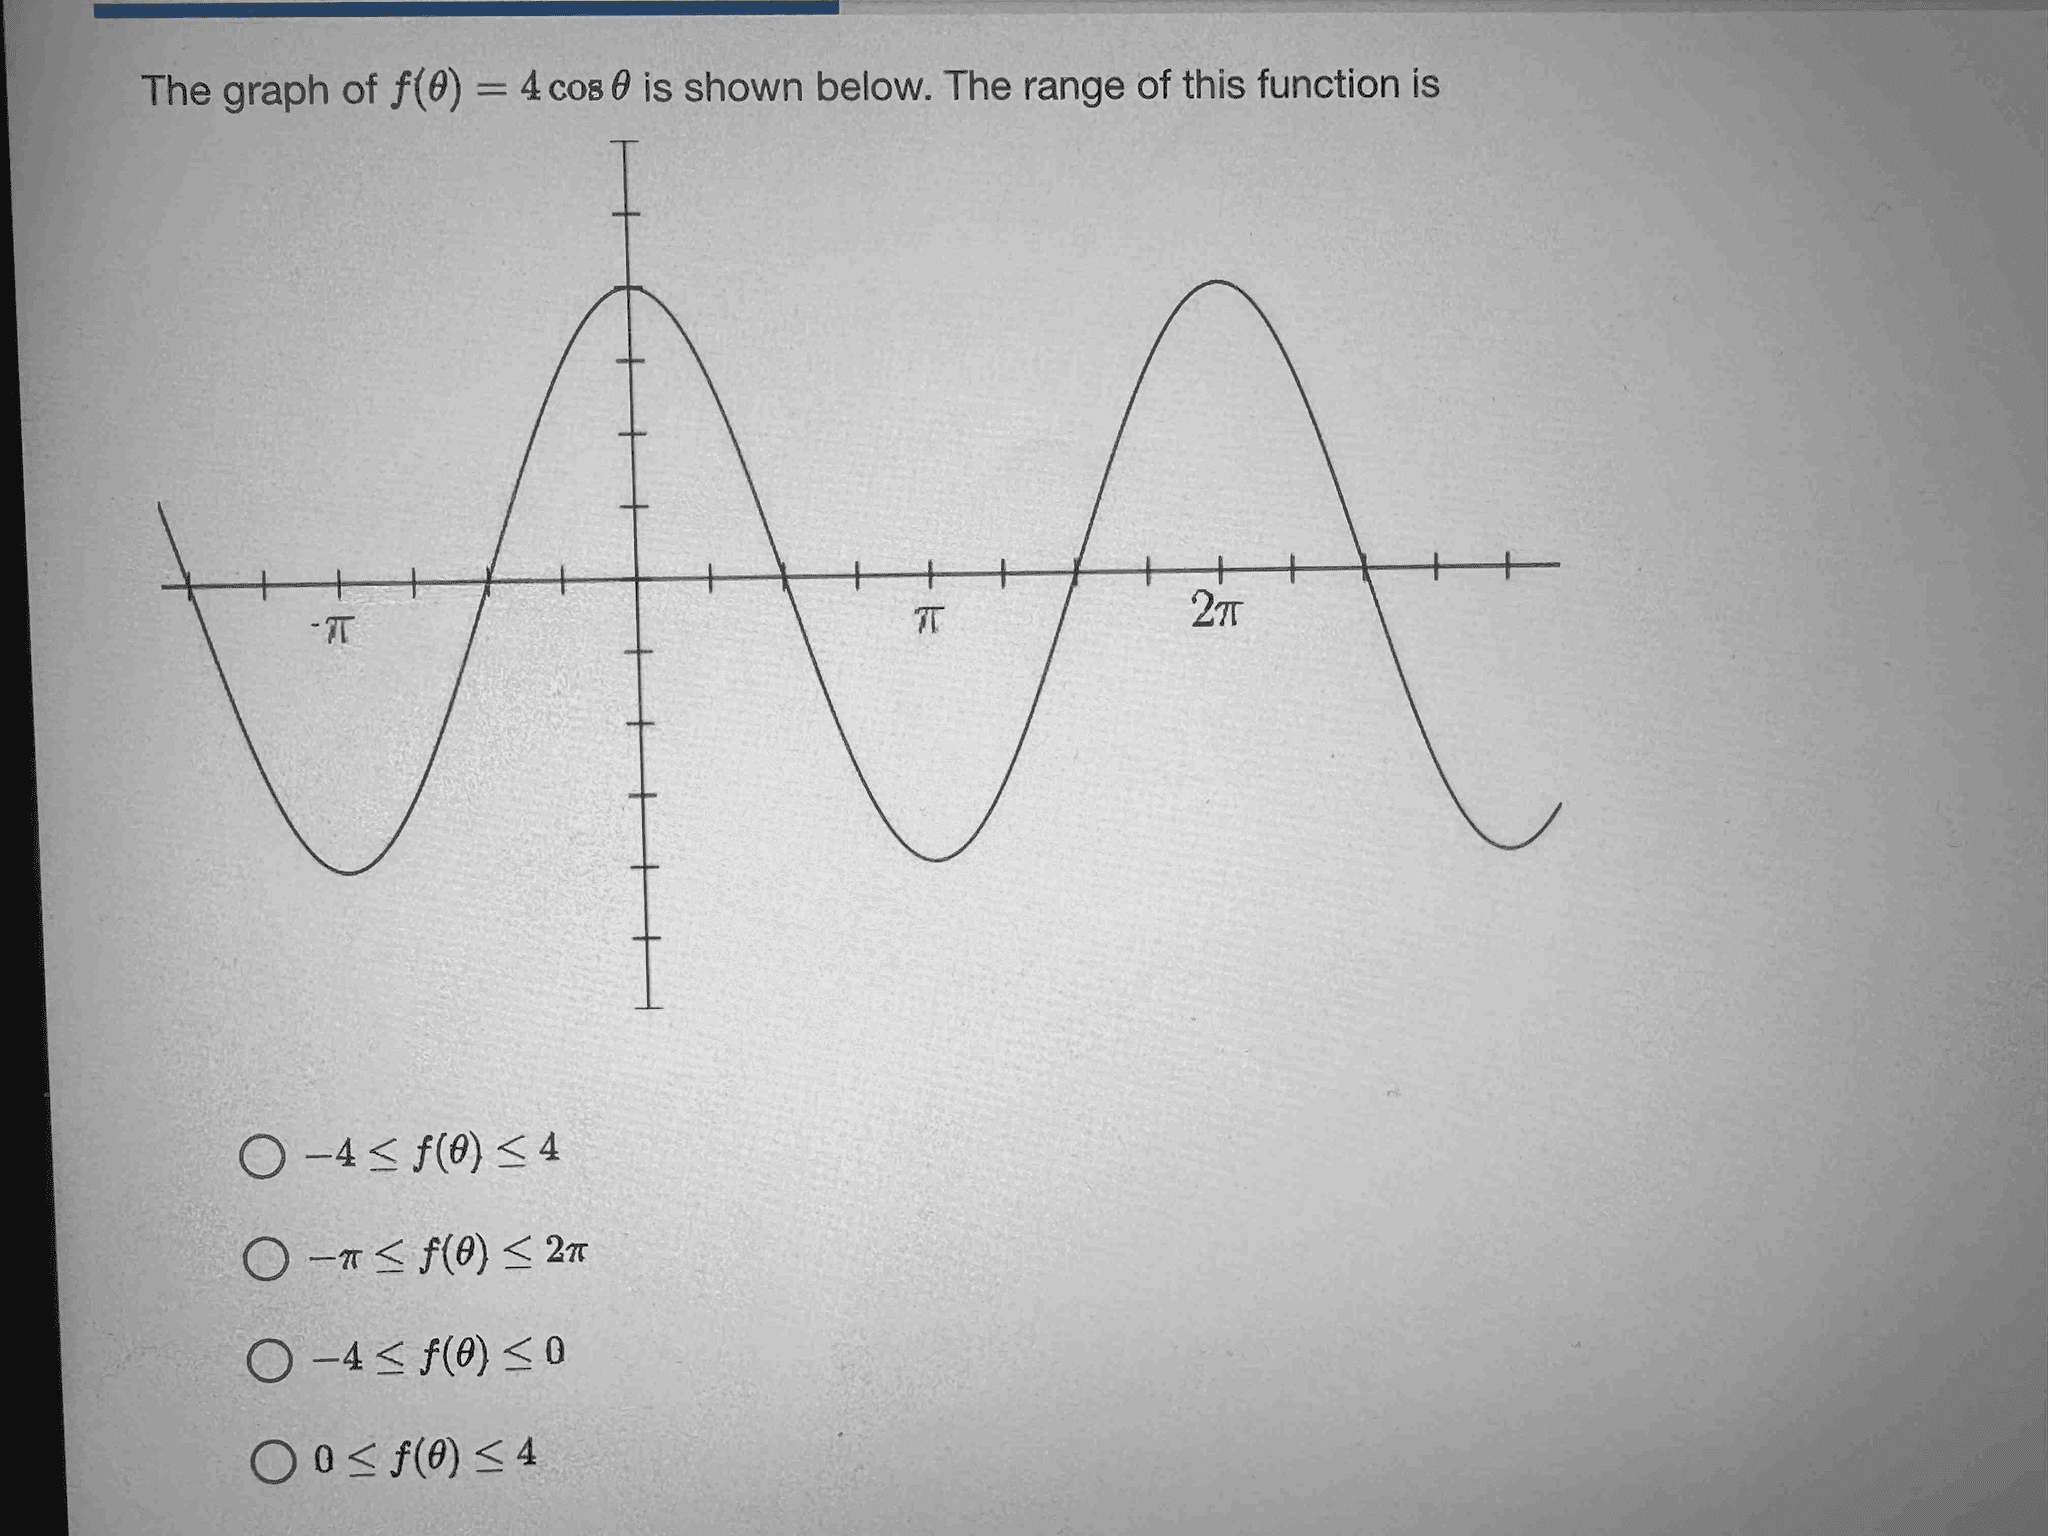
The graph of f(0) = 4 COS A is shown below. The range of this function is
2TT
IT
-IT
-(f) 2n

Answer from Sia
Posted over 1 year ago
It seems like you've uploaded an image of a graph with a wave-like curve that oscillates between y = 4 and y = -4. The function represented by the graph is f(0) = 4 COS A. The range of this function is 2π, -π, -π, and 2π. How can I assist you further with understanding this graph and function?Not the question you are looking for? Ask here!
Enter question by text
Enter question by image
Unlock Smarter Learning with AskSia Super!
Join Super, our all-in-one AI solution that can greatly improve your learning efficiency.
30% higher accuracy than GPT-4o
Entire learning journey support
The most student-friendly features
Study Other Question
