
AskSia

Question
Math
Posted about 2 years ago
The histogram summarizes the number of tropical storms per year in the US for 30 years.
What interval contains the percentile for this data?
Choose 1 answer:
(A) 50 to 75 tropical storms
(B) 75 to 100 tropical storms
(C) 100 to 125 tropical storms
(D) 125 to 150 tropical storms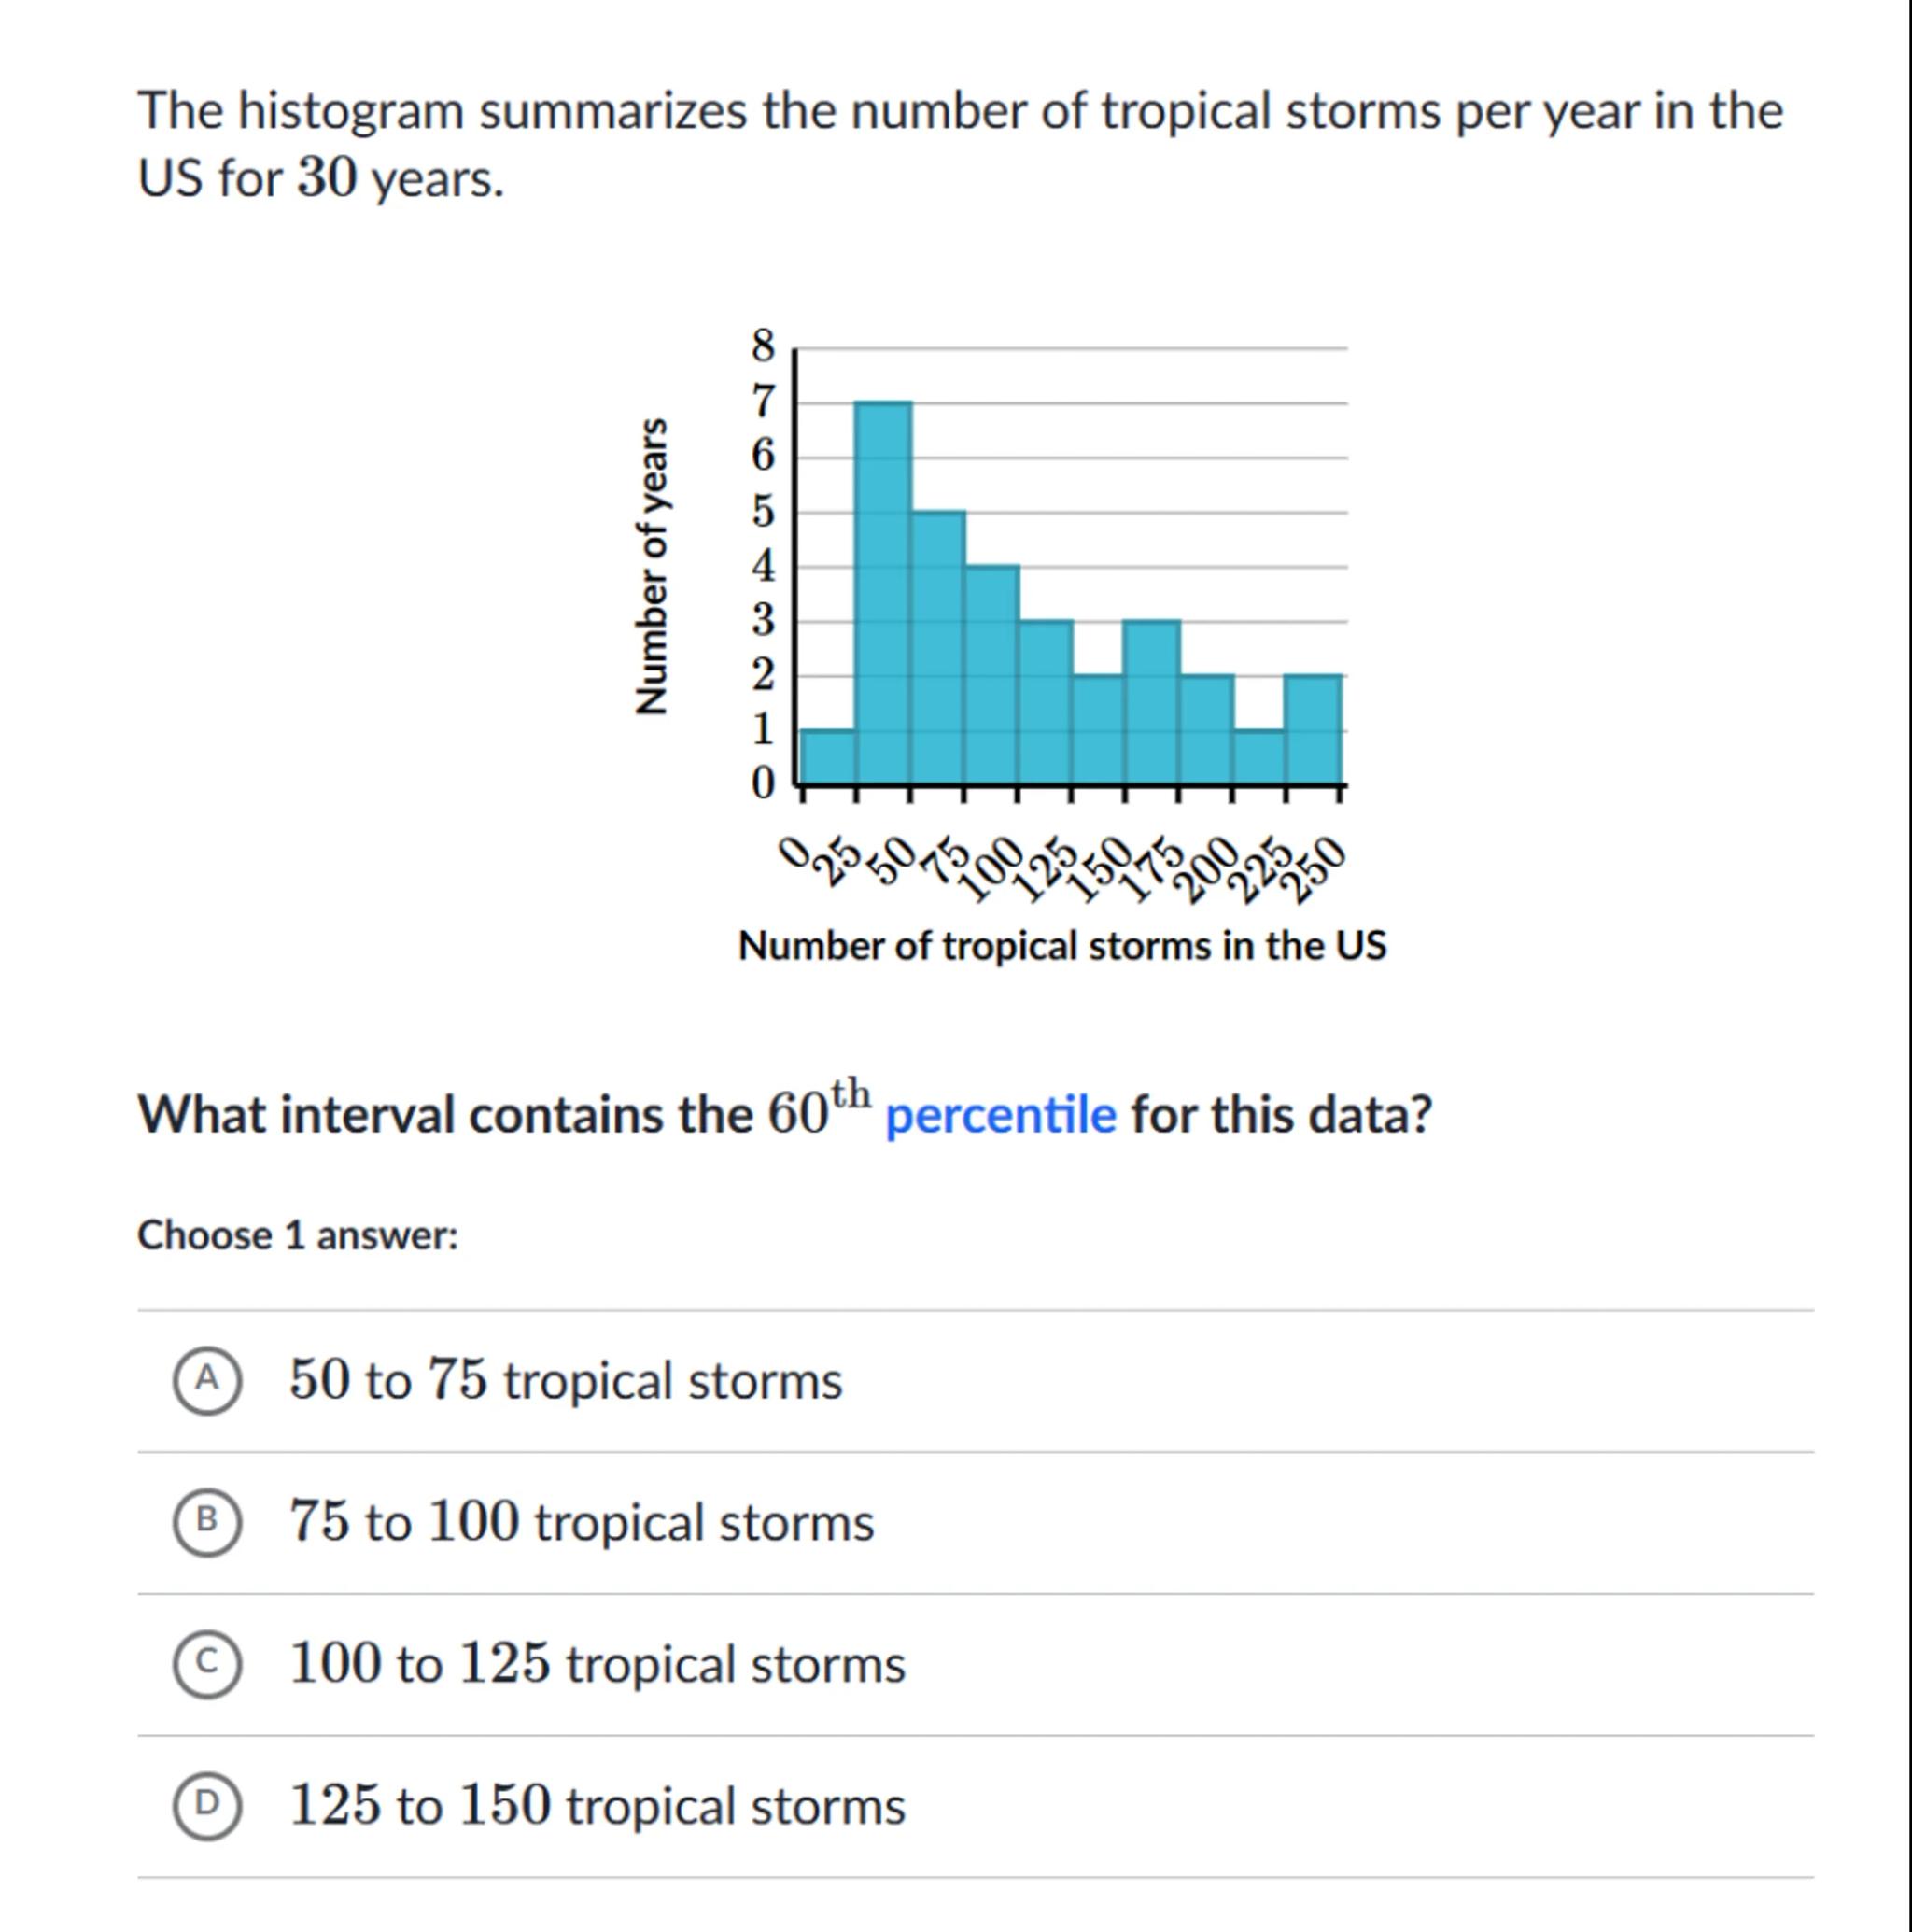
 Sign in to unlock the answer
Answer from Sia
Posted about 2 years ago
Solution by Steps
step 1
To find the percentile, we need to determine the value below which 60% of the data falls
step 2
Since the data spans 30 years, the percentile will be the value below which 18 years of data fall, because of 30 years is years
step 3
We examine the histogram and add up the frequencies (number of years) from the lowest interval upwards until the cumulative frequency reaches or exceeds 18
step 4
The interval that causes the cumulative frequency to reach or exceed 18 will contain the percentile
Answer
The interval that contains the percentile for this data is (A) 50 to 75 tropical storms.
Key Concept
Percentiles in a Histogram
Explanation
The percentile is the value below which 60% of the data falls. In a histogram, this is found by adding the frequencies of the intervals from the lowest upwards until the cumulative frequency is equal to or greater than 60% of the total number of observations.
Not the question you are looking for? Ask here!
Enter question by text
Enter question by image

Unlock Smarter Learning with AskSia Super!
Join Super, our all-in-one AI solution that can greatly improve your learning efficiency.
30% higher accuracy than GPT-4o
Entire learning journey support
The most student-friendly features

Study Other Question