Sia

Question
Math
Posted almost 2 years ago
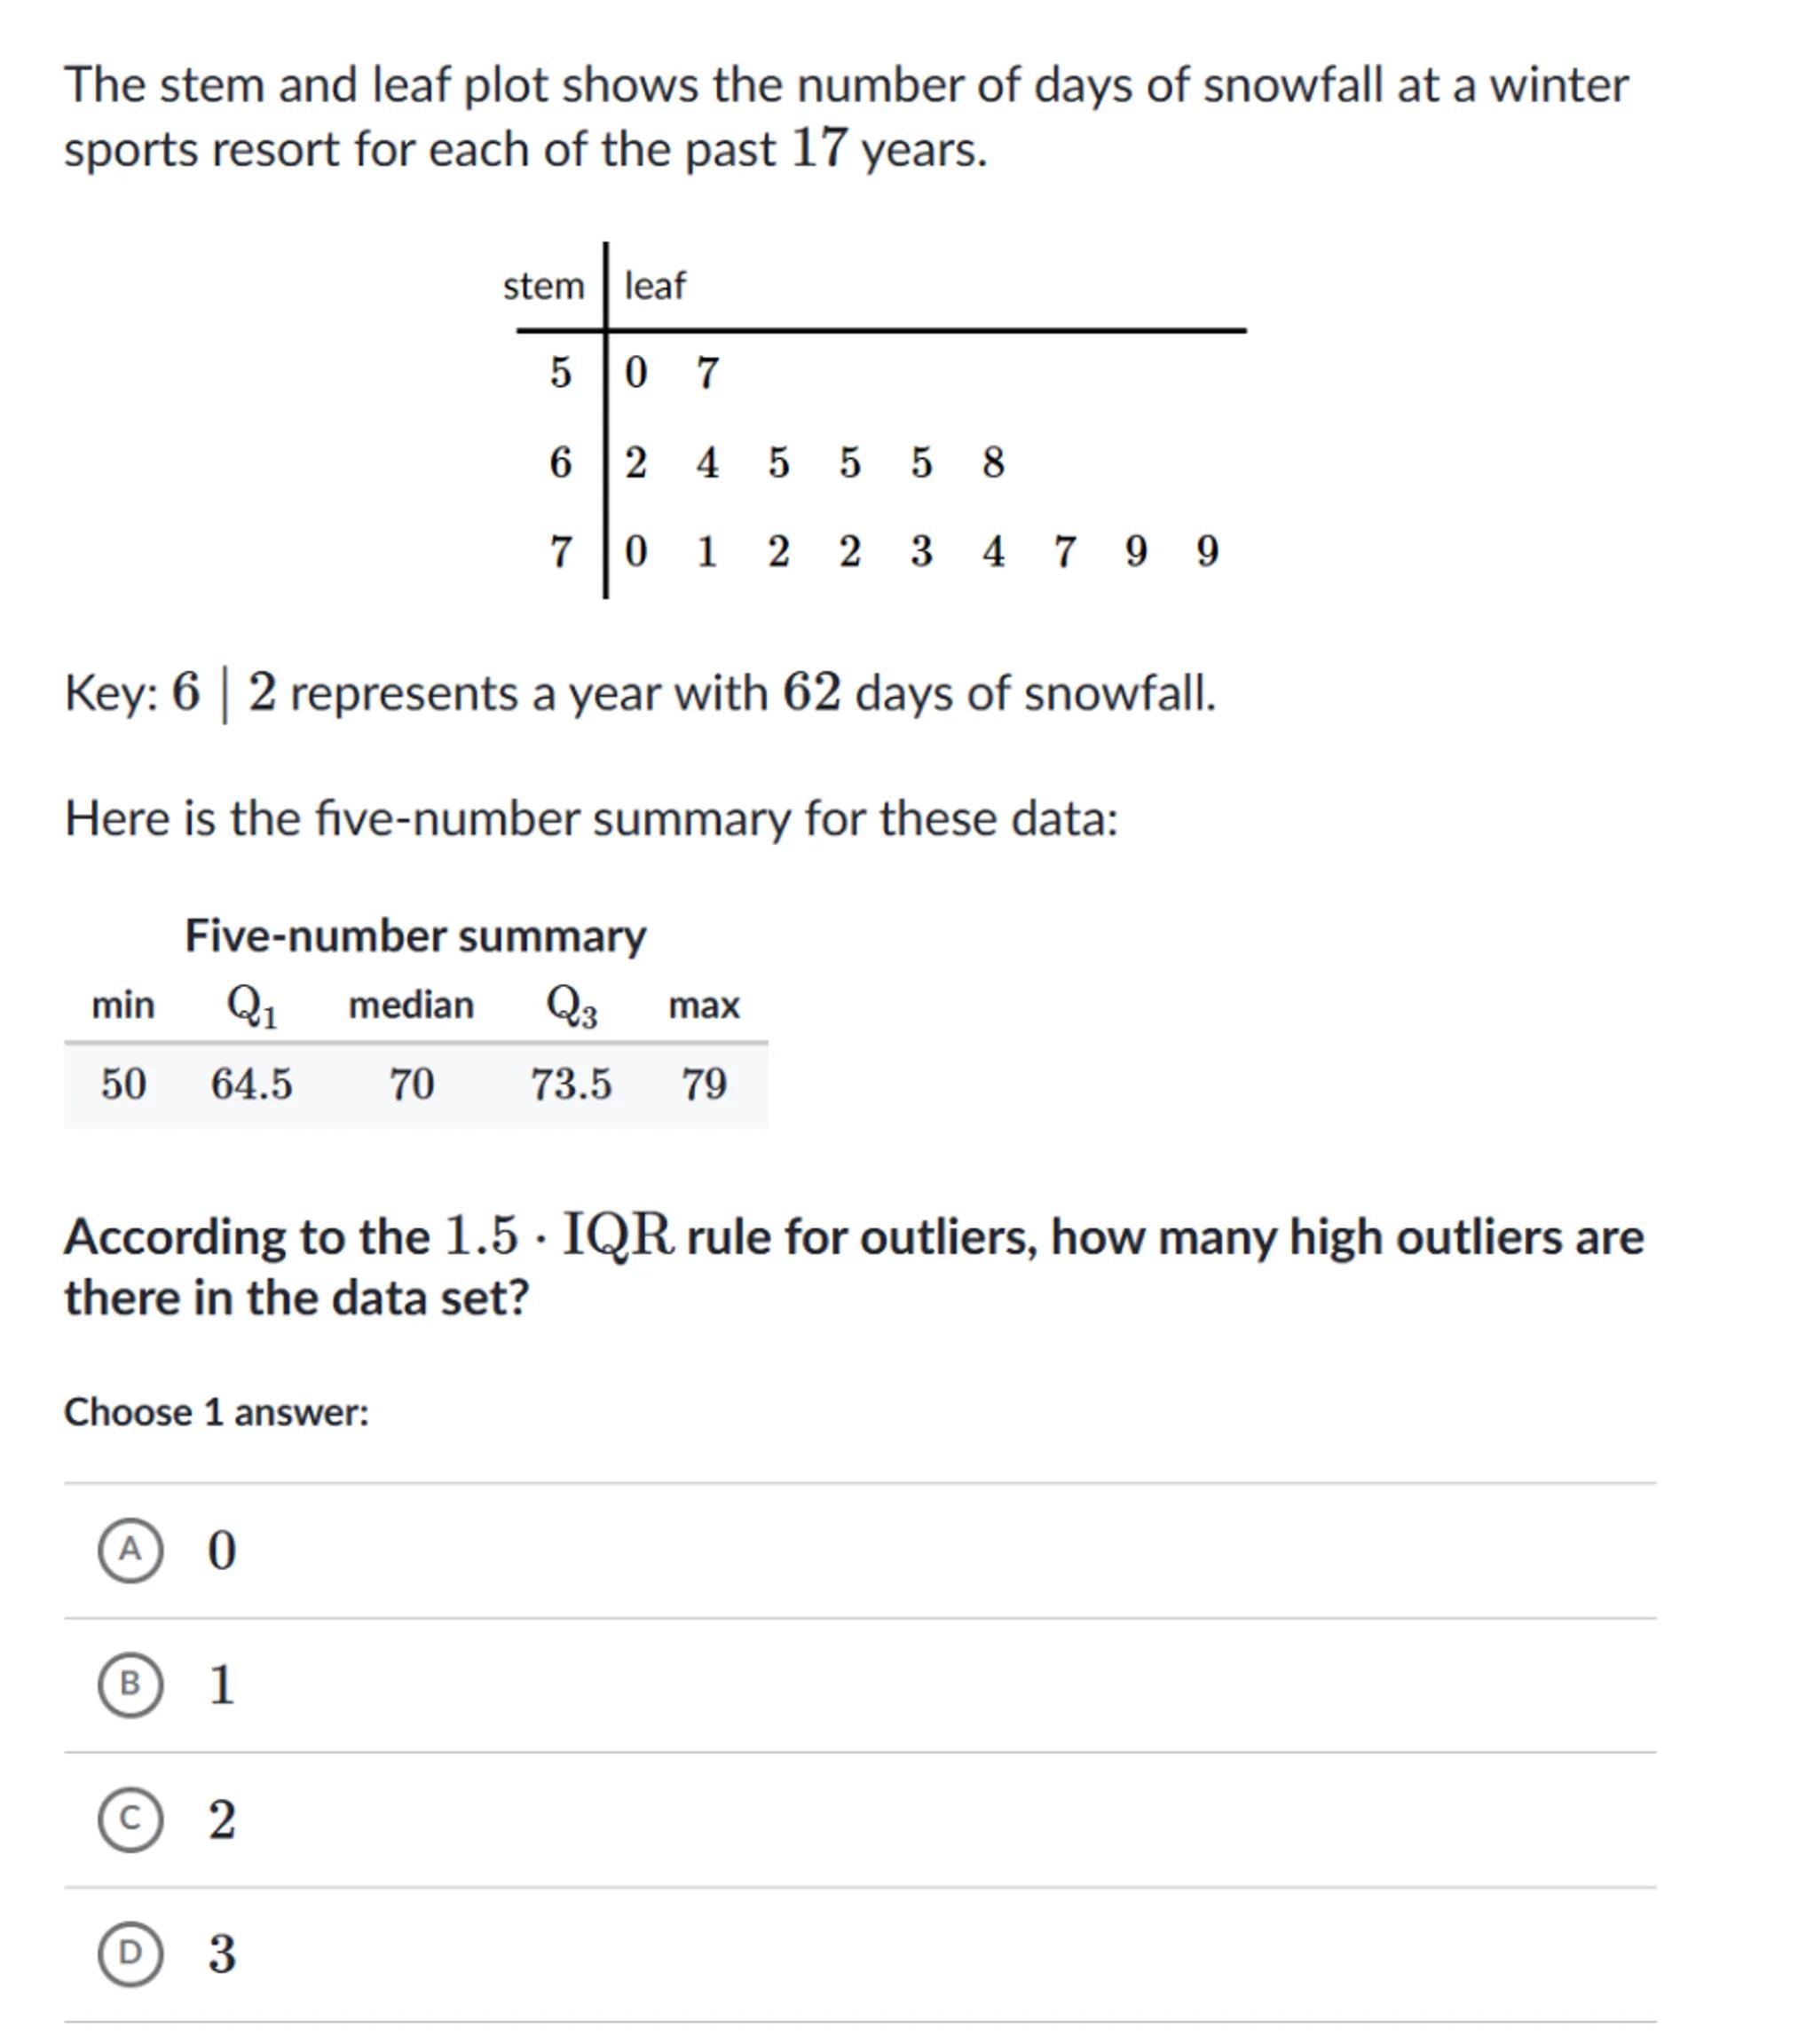
The stem and leaf plot shows the number of days of snowfall at a winter sports resort for each of the past 17 years.
\begin{tabular}{c|llllllllll}
stem & leaf & & & & & & & \\
\hline 5 & 0 & 7 & & & & & & & \\
6 & 2 & 4 & 5 & 5 & 5 & 8 & & & \\
7 & 0 & 1 & 2 & 2 & 3 & 4 & 7 & 9 & 9
\end{tabular}
Key: represents a year with 62 days of snowfall.
Here is the five-number summary for these data:
Five-number summary
\begin{tabular}{ccccc}
& & median & & \\
\hline 50 & 64.5 & 70 & 73.5 & 79
\end{tabular}
According to the rule for outliers, how many high outliers are there in the data set?
Choose 1 answer:
(A) 0
(B)
(C) 2
(D) 3

Answer from Sia
Posted almost 2 years ago
Solution by Steps
step 1
Calculate the interquartile range (IQR) by subtracting the first quartile () from the third quartile ()
step 2
step 3
Determine the threshold for high outliers by adding to the third quartile ()
step 4
High outlier threshold =
step 5
Identify the number of data points exceeding the high outlier threshold. According to the stem-and-leaf plot, there are no data points above 87, so there are no high outliers
Answer
(A) 0
Key Concept
1.5 IQR Rule for Outliers
Explanation
The 1.5 IQR rule is used to identify outliers by creating a threshold above or below which data points are considered outliers. In this case, no data points exceed the high outlier threshold, so there are no high outliers.
Not the question you are looking for? Ask here!
Enter question by text
Enter question by image
Unlock Smarter Learning with AskSia Super!
Join Super, our all-in-one AI solution that can greatly improve your learning efficiency.
30% higher accuracy than GPT-4o
Entire learning journey support
The most student-friendly features
Study Other Question