
AskSia

Question
Microeconomics
Posted about 2 years ago
This graph illustrates the market for labor that is used to produce board games.

Which of the following would cause the change shown here?

Choose 1 answer:
(A) Worker productivity increases.

B There is an increase in unskilled labor in this market
(c) The demand for board games decreases.
(D) Large portions of the population retire
(E) An increase in the preference for leisure

Related content
Shifts in the demand for labor
Report a problem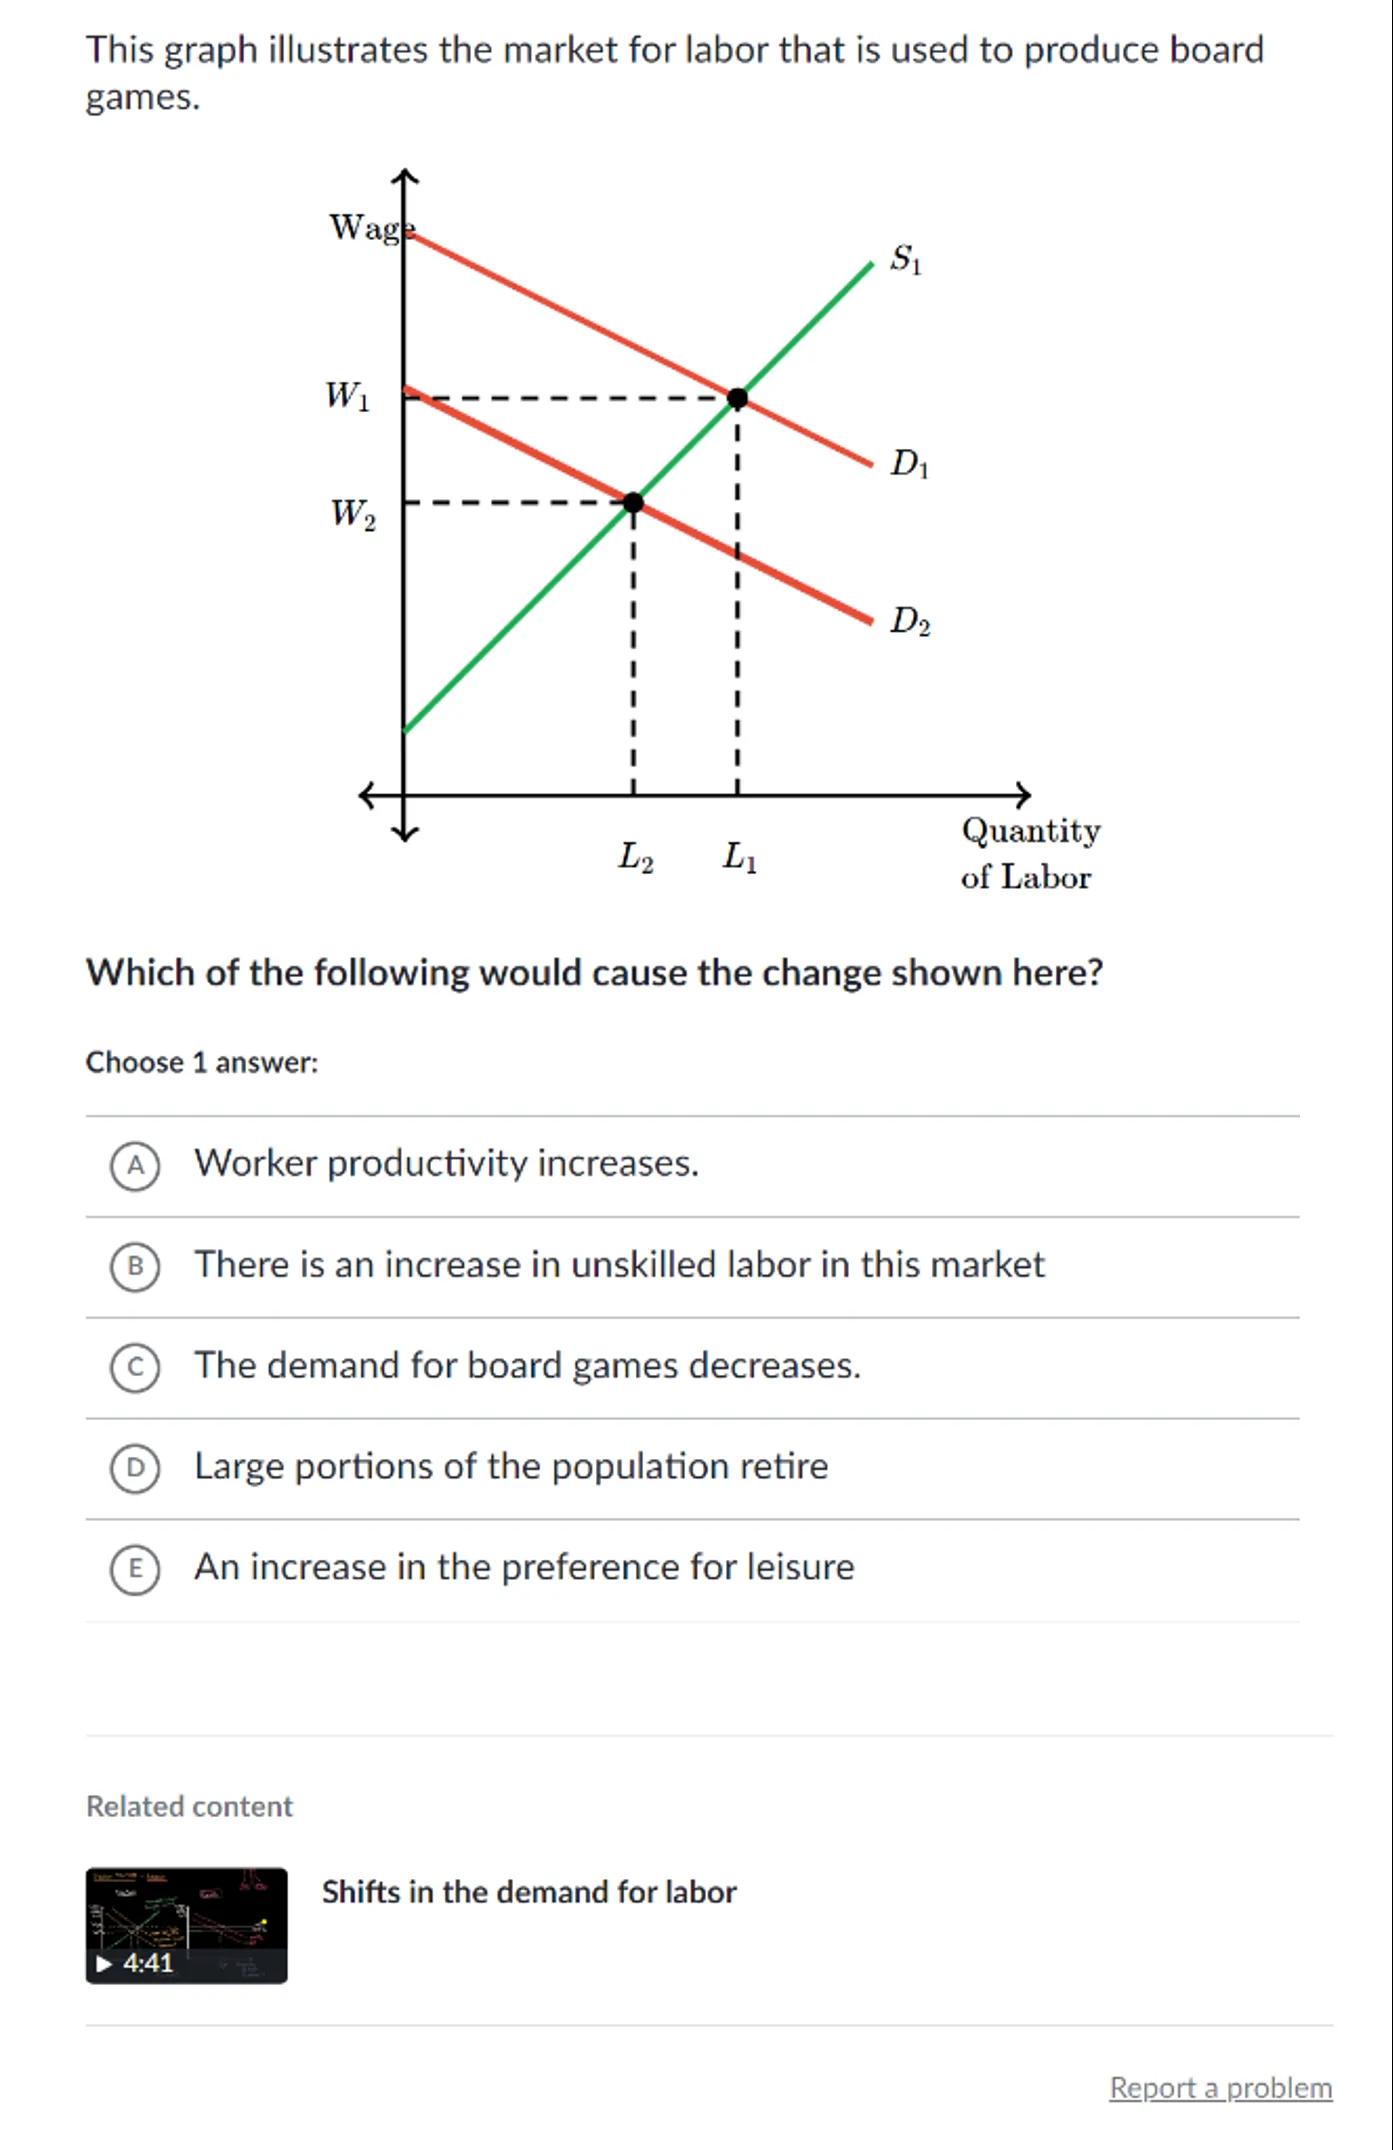
 Sign in to unlock the answer
Answer from Sia
Posted about 2 years ago
Solution
a
Graph Analysis: The graph shows the labor market for producing board games with two demand curves (D1 and D2) and one supply curve (S1). The initial equilibrium is at the intersection of D1 and S1, with wage W1 and labor quantity L1. The new equilibrium is at the intersection of D2 and S1, with wage W2 and labor quantity L2
b
Demand Shift: The shift from D1 to D2 represents a decrease in the demand for labor. This is indicated by the parallel downward shift of the demand curve
c
Decrease in Demand: A decrease in the demand for labor can be caused by a decrease in the demand for the product being produced, in this case, board games
d
Correct Answer: Among the given options, the decrease in the demand for board games (Option C) is the most likely cause of the shift from D1 to D2
Answer
The demand for board games decreases.
Key Concept
Demand for labor is derived from the demand for the product being produced.
Explanation
A decrease in the demand for board games leads to a decrease in the demand for labor used to produce them, shifting the demand curve for labor to the left.
Not the question you are looking for? Ask here!
Enter question by text
Enter question by image

Unlock Smarter Learning with AskSia Super!
Join Super, our all-in-one AI solution that can greatly improve your learning efficiency.
30% higher accuracy than GPT-4o
Entire learning journey support
The most student-friendly features

Study Other Question