Sia

Question
Microeconomics
Posted over 1 year ago
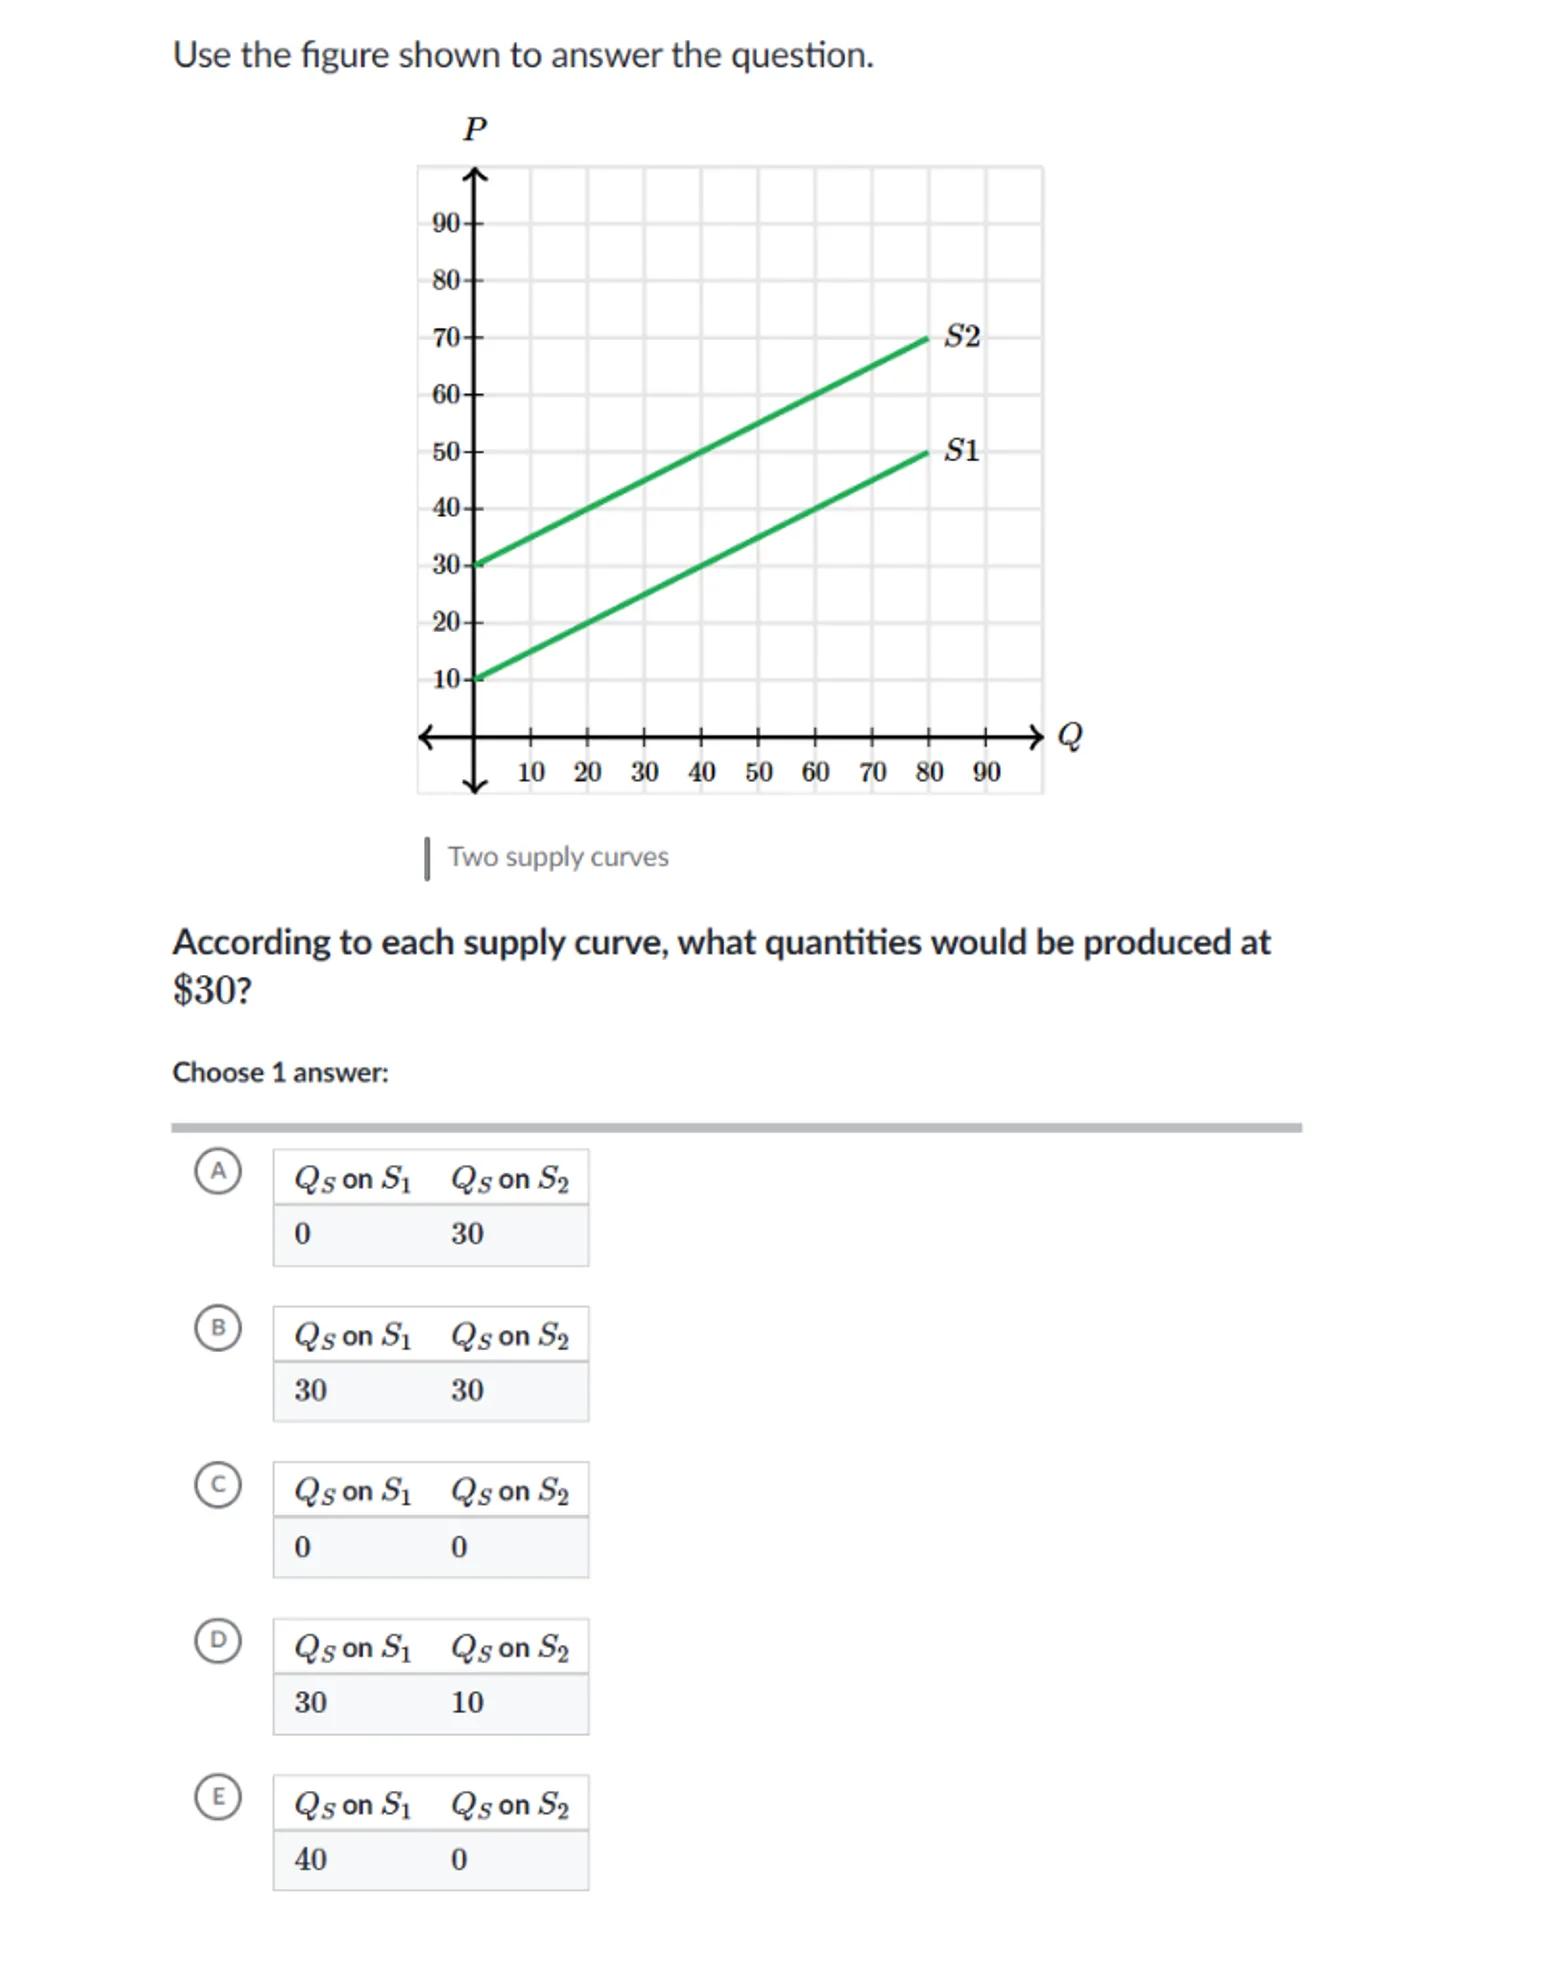
Use the figure shown to answer the question.
Two supply curves
According to each supply curve, what quantities would be produced at ?
Choose 1 answer:
(A)
\begin{tabular}{|ll|}
\hline on & on \\
\hline 0 & 30 \\
\hline
\end{tabular}
(B)
\begin{tabular}{|ll|}
\hline on & on \\
\hline 30 & 30 \\
\hline
\end{tabular}
(C)
\begin{tabular}{|ll|}
\hline on & on \\
\hline 0 & 0 \\
\hline
\end{tabular}
(D)
\begin{tabular}{|ll|}
\hline on & on \\
\hline 30 & 10 \\
\hline
\end{tabular}
(E)
\begin{tabular}{|ll|}
\hline on & on \\
\hline 40 & 0 \\
\hline
\end{tabular}

Answer from Sia
Posted over 1 year ago
Solution
a
Identify the price level: The price level given is $30
b
Locate the quantity supplied on : At , find the corresponding on the supply curve
c
Locate the quantity supplied on : At , find the corresponding on the supply curve
d
Read the graph: For , at , . For , at ,
e
Choose the correct answer: The quantities produced at are and
Answer
(E) on = 40, on = 0
Key Concept
Supply Curve Analysis
Explanation
The supply curve shows the relationship between price and quantity supplied. By locating the price on the y-axis and finding the corresponding quantity on each supply curve, we can determine the quantities supplied at that price.
Not the question you are looking for? Ask here!
Enter question by text
Enter question by image
Unlock Smarter Learning with AskSia Super!
Join Super, our all-in-one AI solution that can greatly improve your learning efficiency.
30% higher accuracy than GPT-4o
Entire learning journey support
The most student-friendly features
Study Other Question