Sia

Question
Microeconomics
Posted over 1 year ago
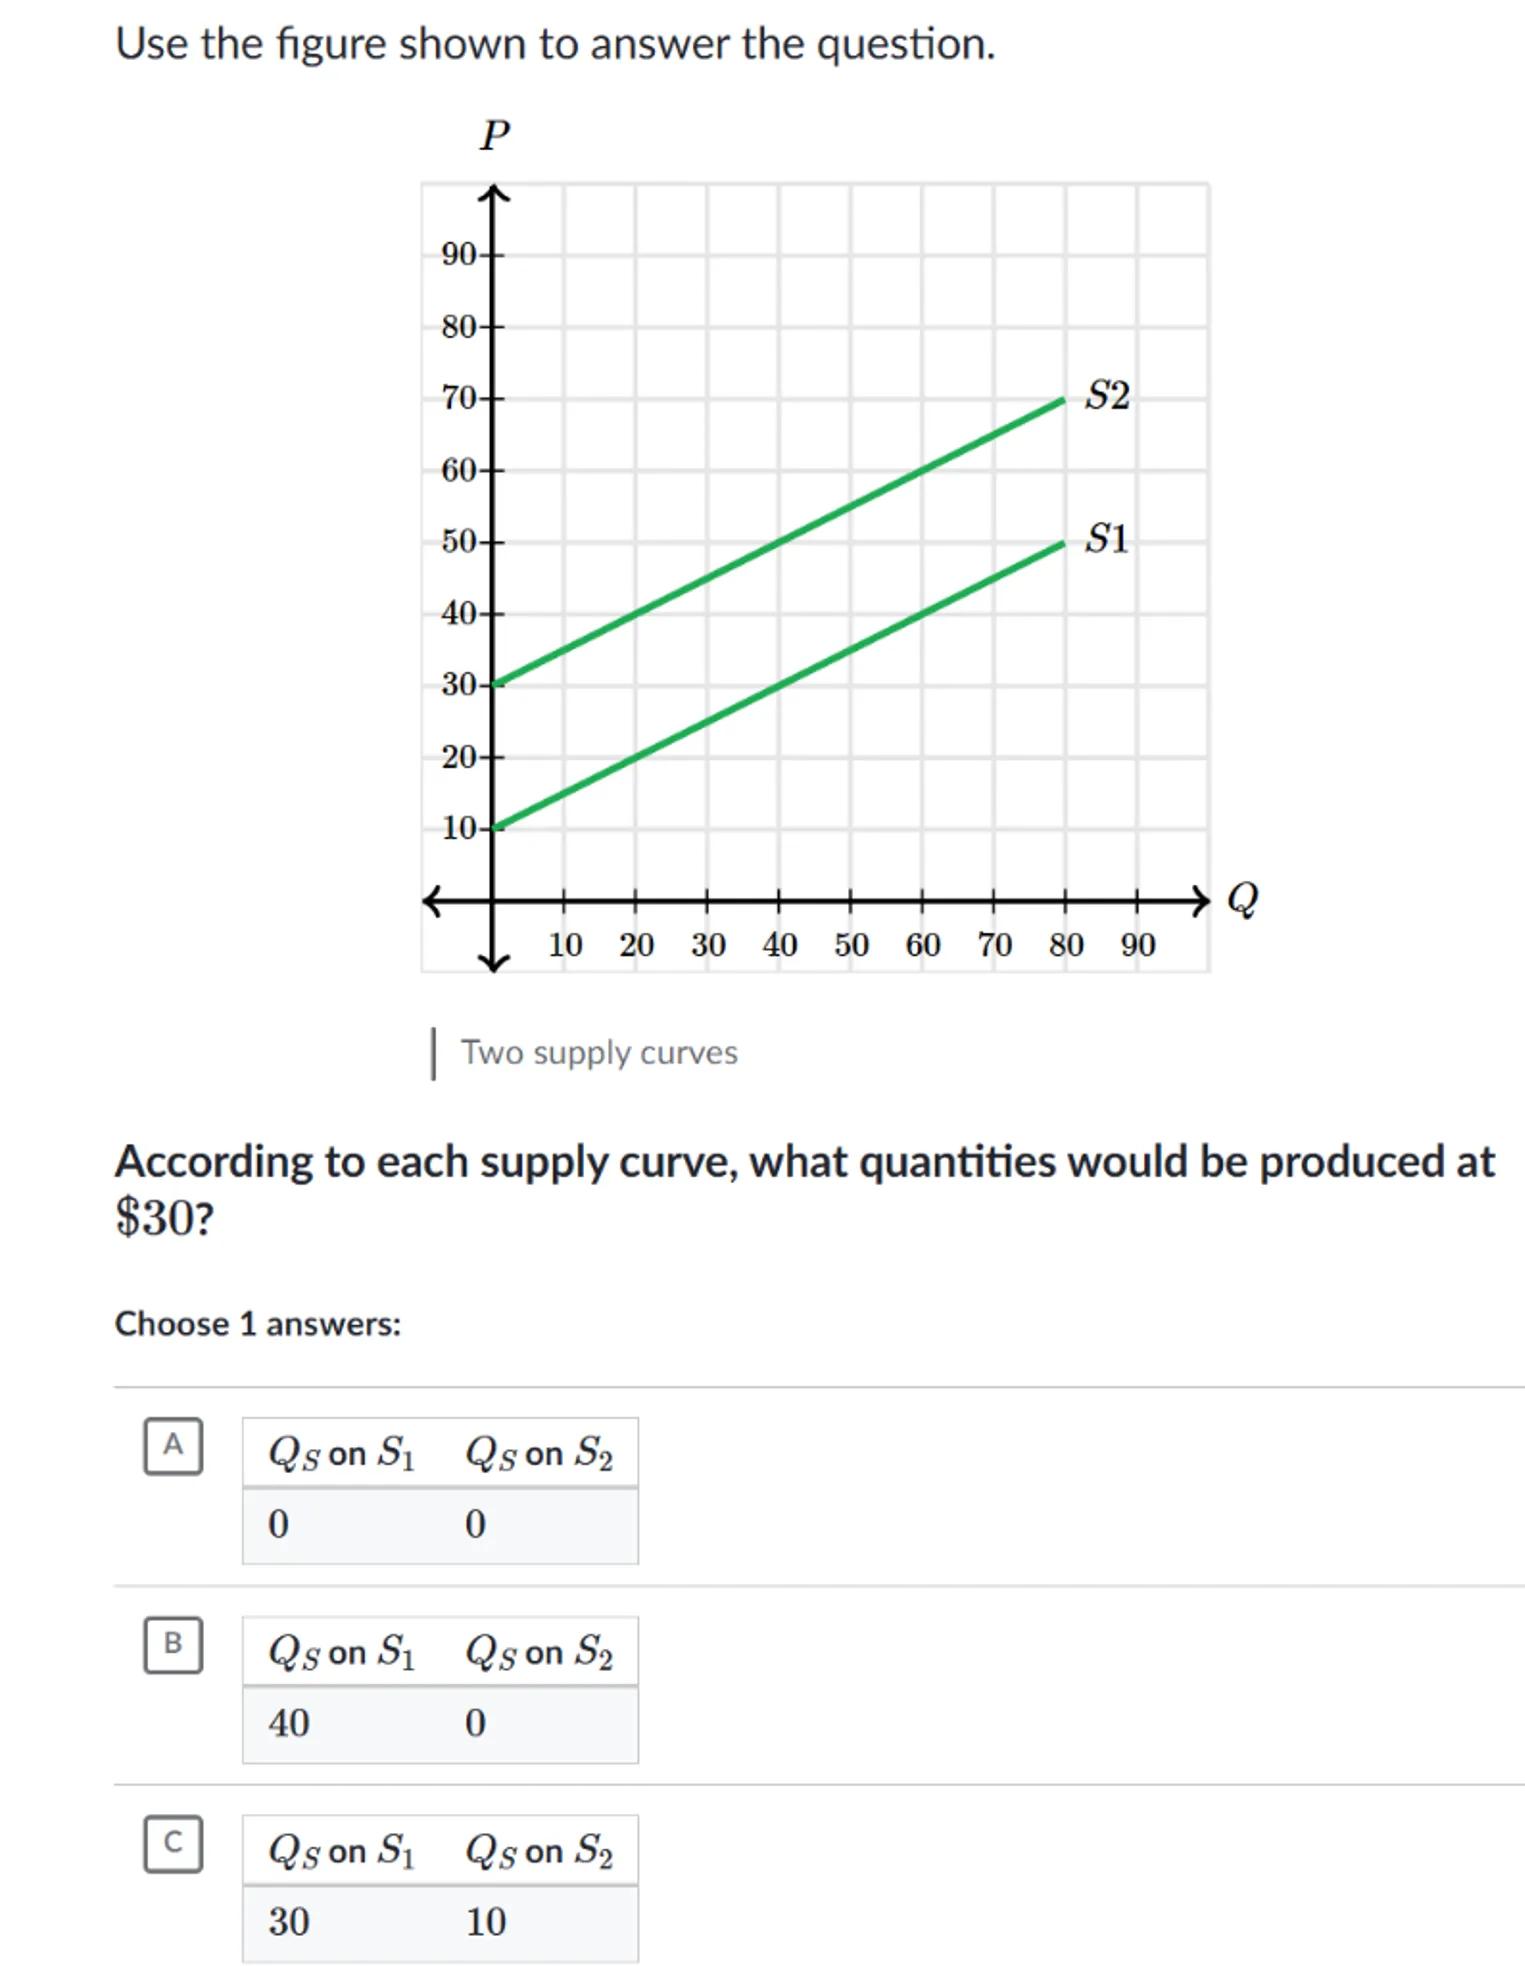
Use the figure shown to answer the question.
Two supply curves
According to each supply curve, what quantities would be produced at ?
Choose 1 answers:
A
\begin{tabular}{|ll|}
\hline on & on \\
\hline 0 & 0 \\
\hline
\end{tabular}
\begin{tabular}{|ll|}
\hline on & on \\
\hline 40 & 0 \\
\hline
\end{tabular}
\begin{tabular}{|ll|}
\hline on & on \\
\hline 30 & 10 \\
\hline
\end{tabular}

Answer from Sia
Posted over 1 year ago
Solution
a
Identify the quantities produced at on each supply curve: For , locate the point where and find the corresponding . Similarly, for , locate the point where and find the corresponding
b
Calculation for : On , when , the corresponding is
c
Calculation for : On , when , the corresponding is
Answer
40 & 10
Key Concept
Supply Curve
Explanation
The quantities produced at a given price can be determined by locating the price on the y-axis and finding the corresponding quantity on the supply curve. For , at , . For , at , $Q = 10
Not the question you are looking for? Ask here!
Enter question by text
Enter question by image
Unlock Smarter Learning with AskSia Super!
Join Super, our all-in-one AI solution that can greatly improve your learning efficiency.
30% higher accuracy than GPT-4o
Entire learning journey support
The most student-friendly features
Study Other Question