
AskSia

Question
Macroeconomics
Posted about 2 years ago
What area represents consumer surplus in the graph shown here if this market is in equilibrium?
Choose 1 answer:
(A)
(B)
(C)
(D)
(द) 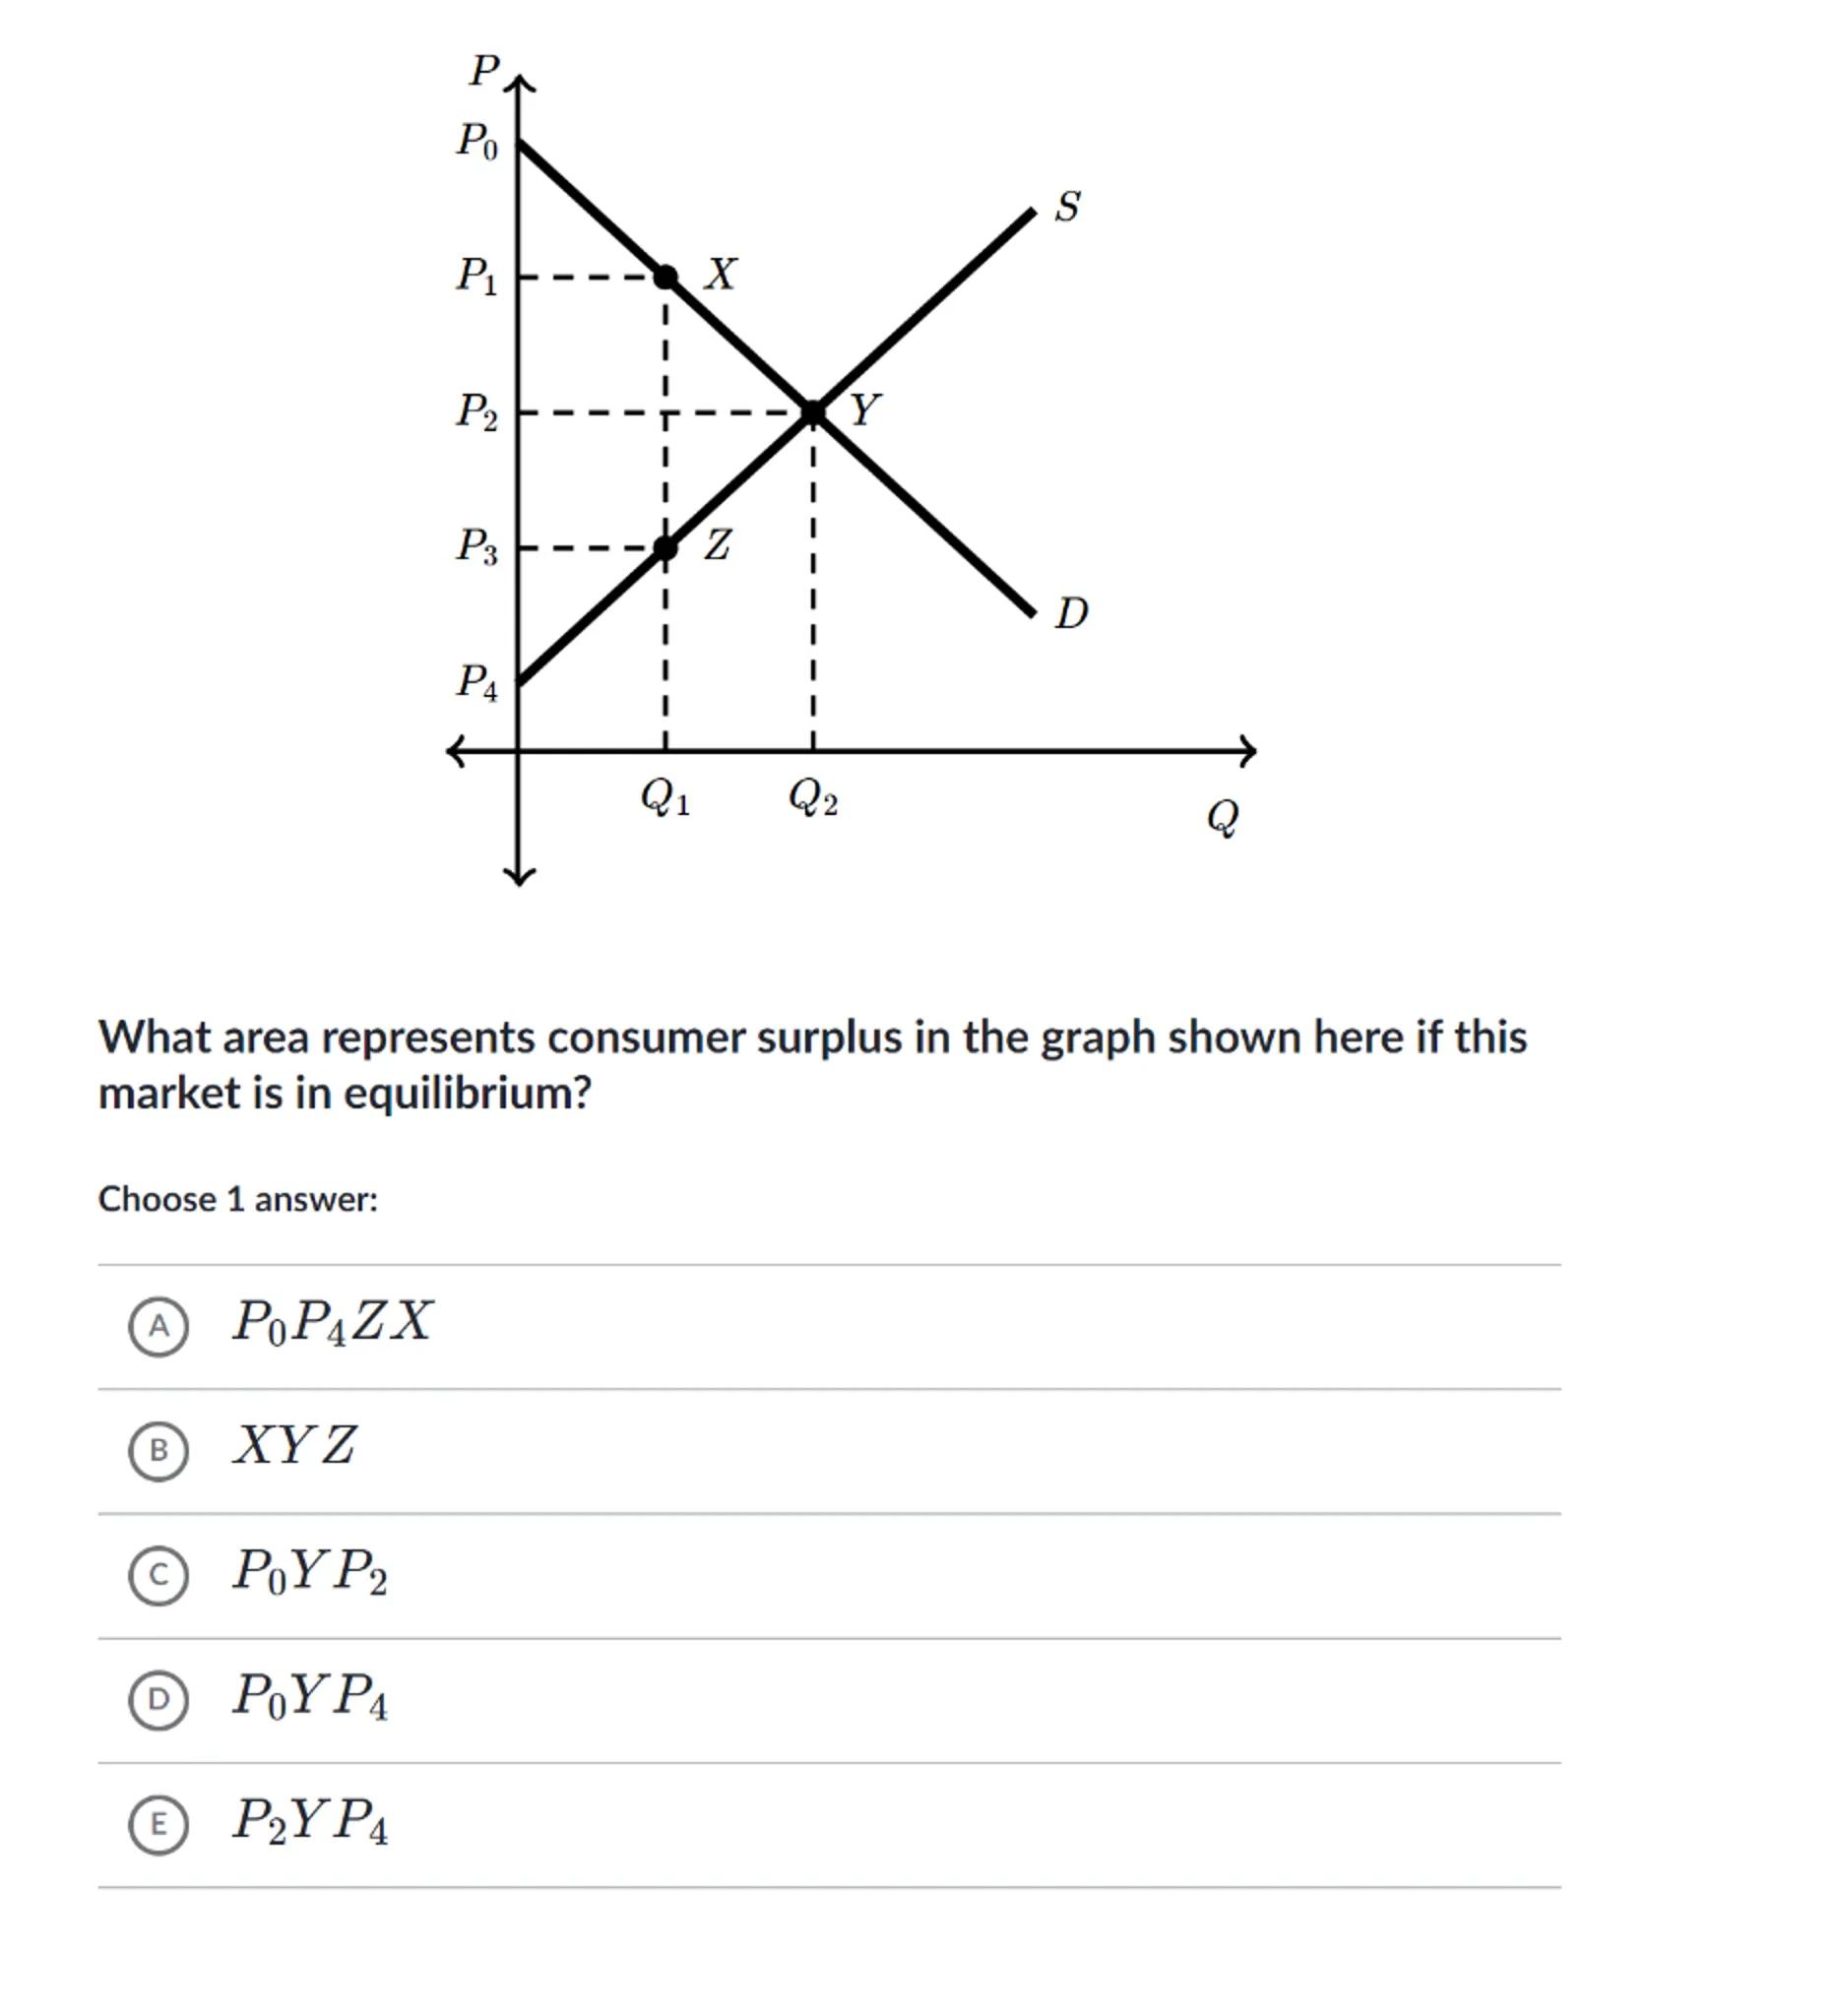
 Sign in to unlock the answer
Answer from Sia
Posted about 2 years ago
Solution
a
Consumer Surplus Definition: Consumer surplus is the difference between what consumers are willing to pay for a good or service and what they actually pay
b
Identifying Consumer Surplus on the Graph: Consumer surplus is represented by the area under the demand curve and above the price level up to the quantity demanded at that price
c
Applying the Definition to the Graph: In the graph provided, the equilibrium price is at P2 and the equilibrium quantity is at Q1. The consumer surplus is the area under the demand curve above price P2 and up to quantity Q1
Answer
(C)
Key Concept
Consumer Surplus in a Graph
Explanation
Consumer surplus is the area below the demand curve and above the equilibrium price, extending horizontally to the equilibrium quantity. In the provided graph, this is the triangular area .
Not the question you are looking for? Ask here!
Enter question by text
Enter question by image

Unlock Smarter Learning with AskSia Super!
Join Super, our all-in-one AI solution that can greatly improve your learning efficiency.
30% higher accuracy than GPT-4o
Entire learning journey support
The most student-friendly features

Study Other Question