
AskSia

Question
Macroeconomics
Posted almost 2 years ago
What area represents producer surplus in the graph shown here if this market is in equilibrium?
Choose 1 answer:
(A)
(B)
(C)
(D)
(द) 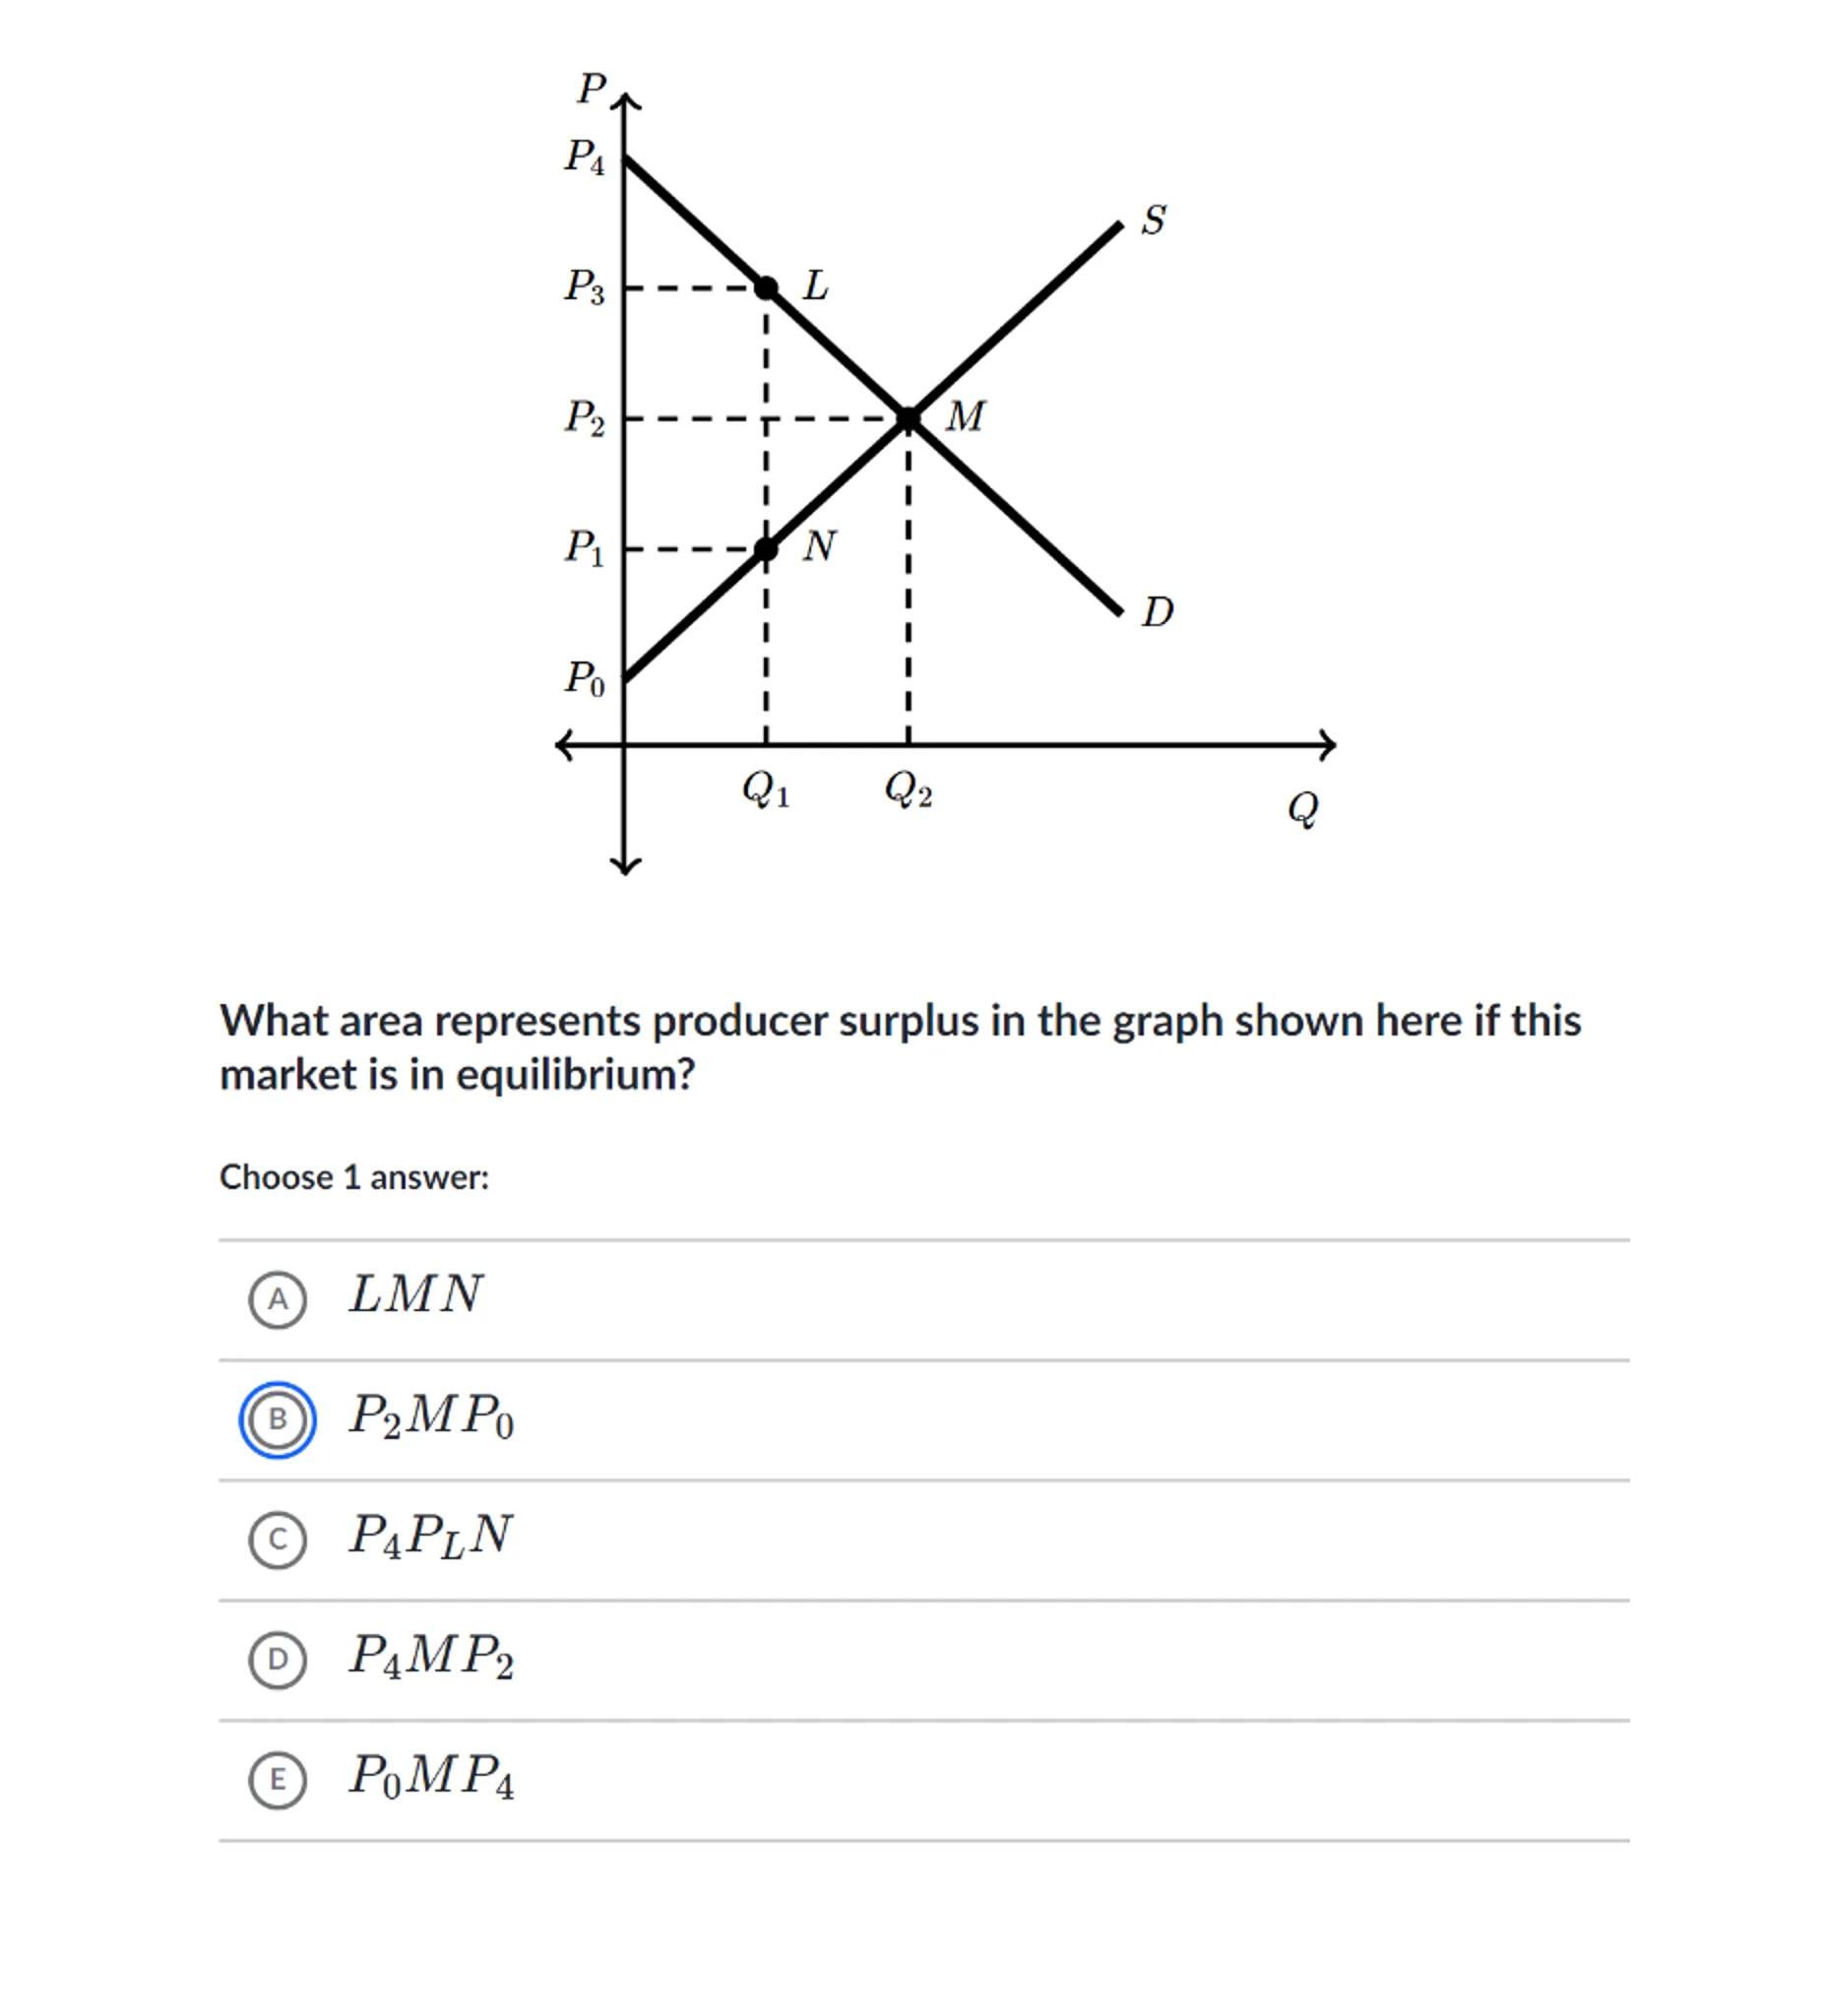
 Sign in to unlock the answer
Answer from Sia
Posted almost 2 years ago
Solution
a
Definition of Producer Surplus: Producer surplus is the difference between what producers are willing to accept for a good or service versus what they actually receive. It is represented by the area above the supply curve and below the market price
b
Identification of Producer Surplus in the Graph: In the provided graph, the producer surplus is the area above the supply curve and below the equilibrium price level. This is because producers would have been willing to supply goods at lower prices but are receiving the equilibrium price
c
Correct Answer: Given the definition and identification of producer surplus, the correct area representing producer surplus in the graph is the triangle formed by the points , , and
Answer
(B)
Key Concept
Producer Surplus in Equilibrium
Explanation
Producer surplus is the area above the supply curve up to the market price, which in this case is the triangle .
Not the question you are looking for? Ask here!
Enter question by text
Enter question by image

Unlock Smarter Learning with AskSia Super!
Join Super, our all-in-one AI solution that can greatly improve your learning efficiency.
30% higher accuracy than GPT-4o
Entire learning journey support
The most student-friendly features

Study Other Question