
AskSia

Question
Math
Posted about 2 years ago
Which graph is generated by the function The positive side of each axis is labeled.
Choose 1 answer:
(A)
(B)
(C)
(D)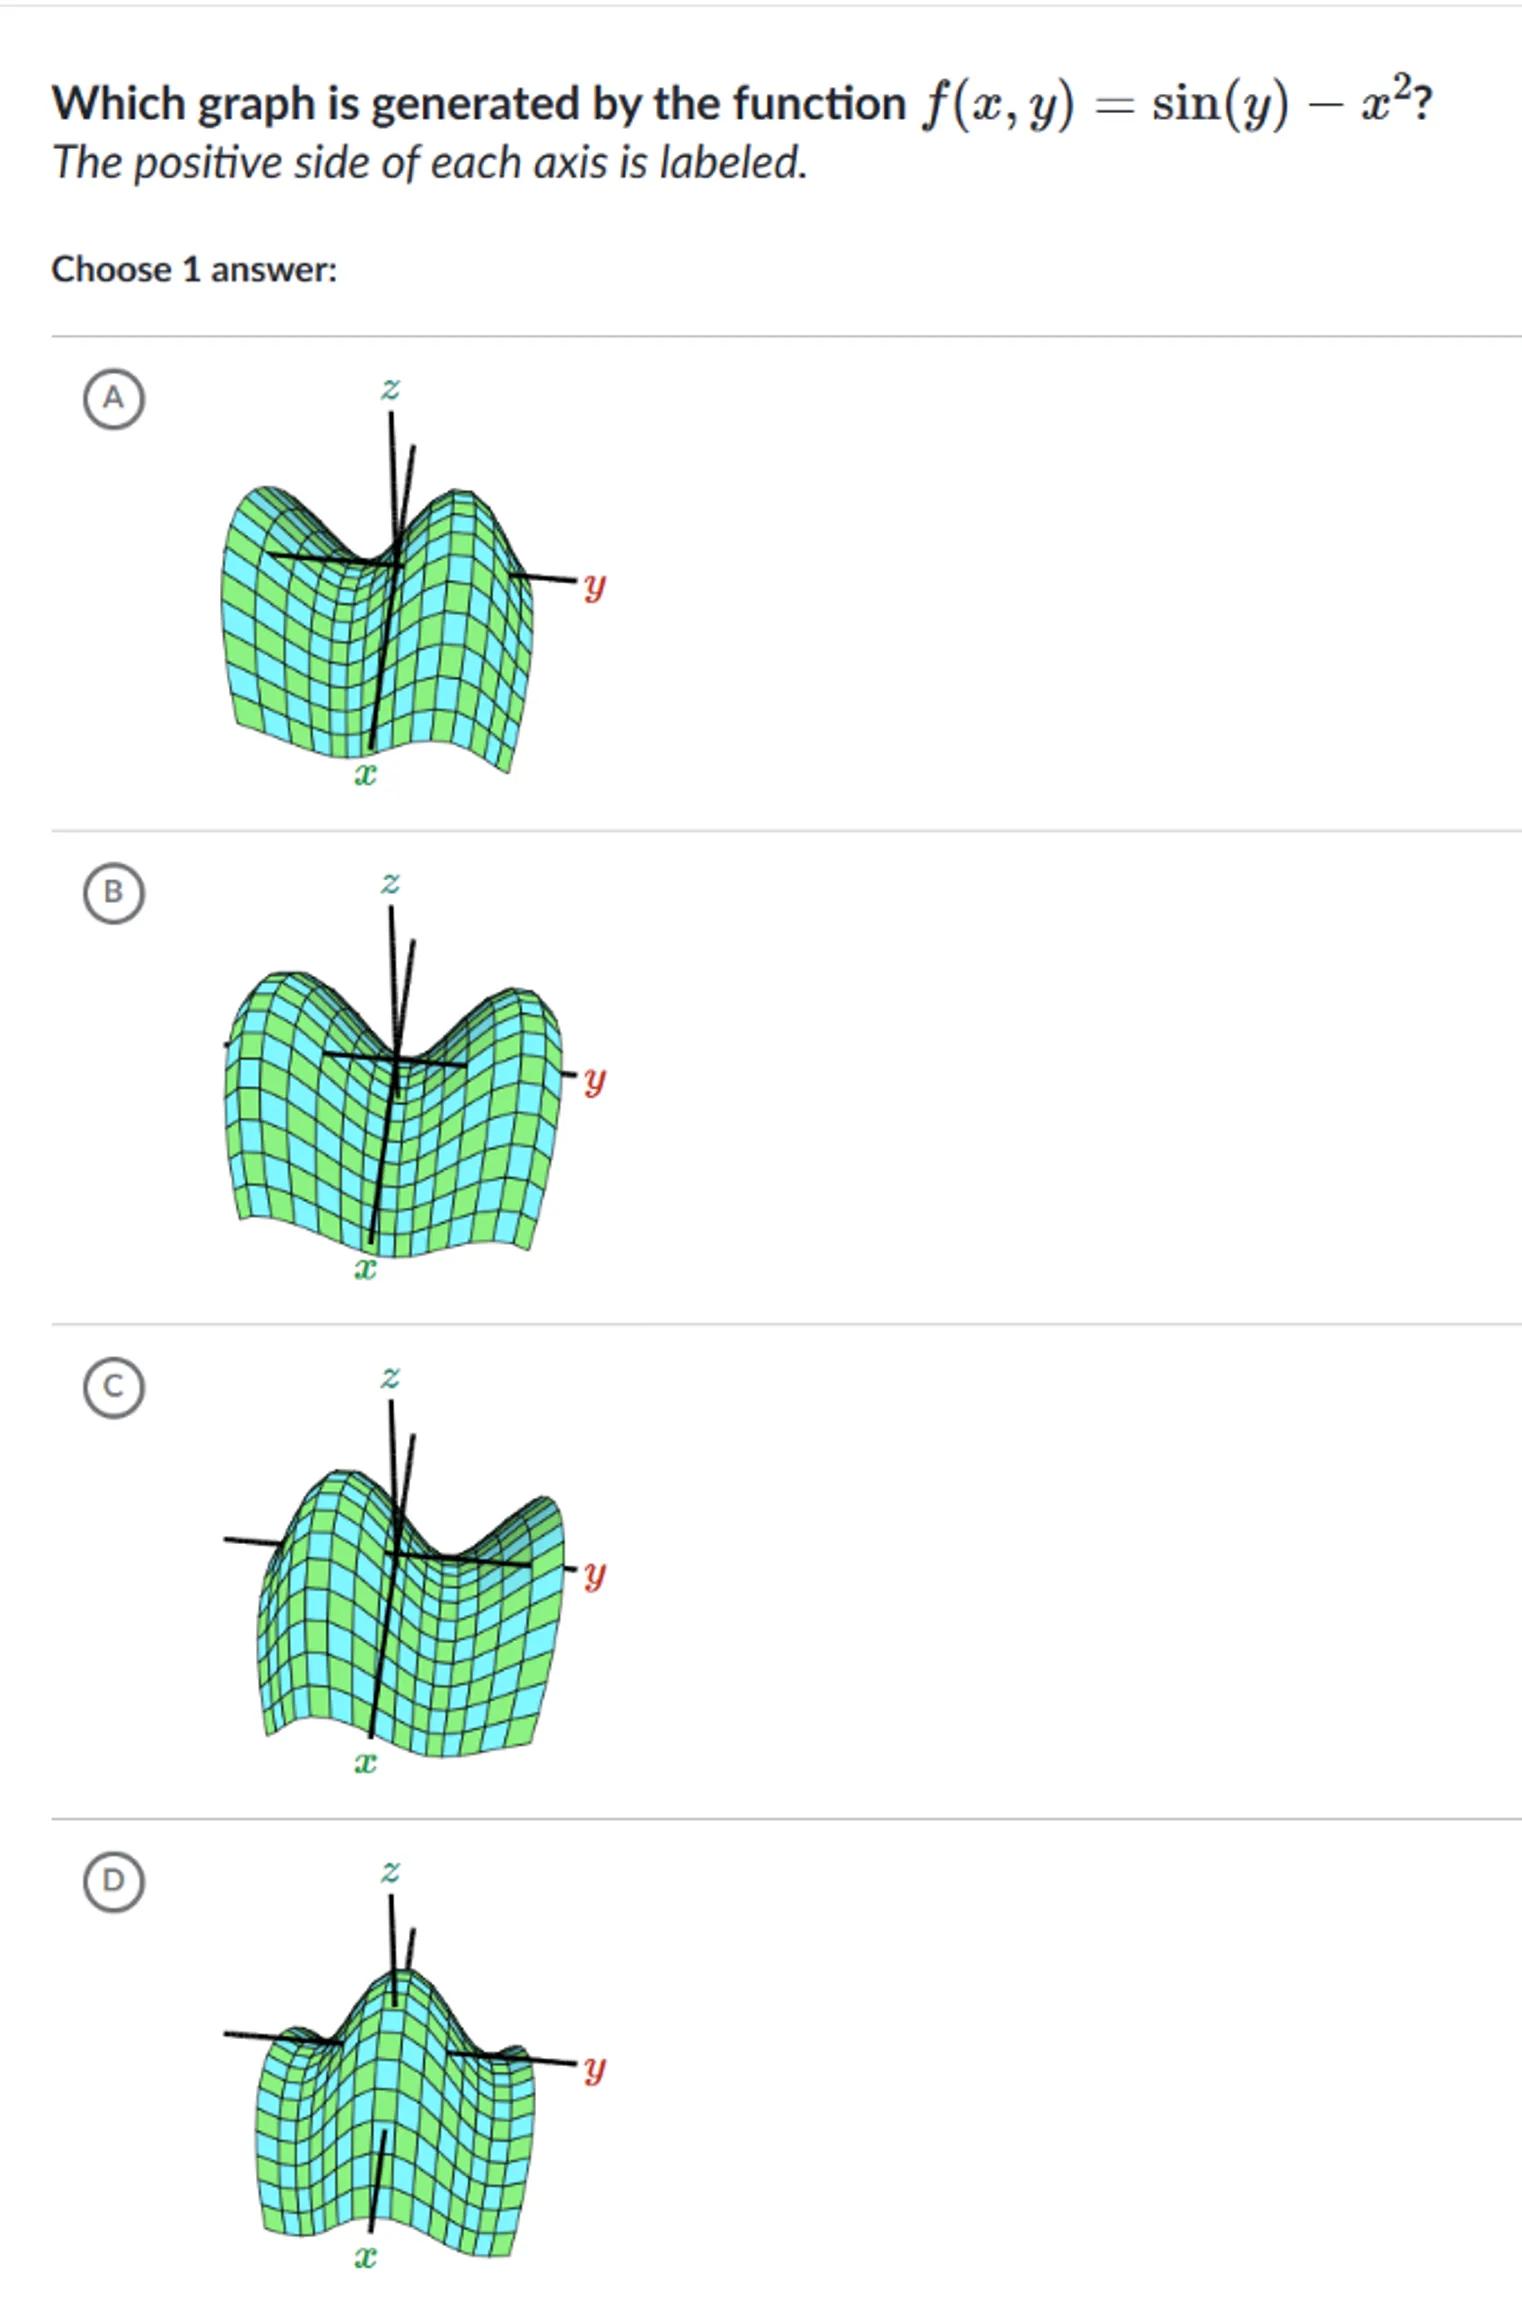
 Sign in to unlock the answer
Answer from Sia
Posted about 2 years ago
Solution by Steps
step 2
The term indicates that there will be a wave-like pattern along the y-axis
step 3
The term indicates that there will be a parabolic curvature opening downwards along the x-axis
step 4
The correct graph should show both of these features: a wave pattern along the y-axis and a downward parabola along the x-axis
C
Key Concept
Graphical representation of functions
Explanation
The graph of should exhibit a sinusoidal pattern along the y-axis due to the term and a parabolic shape along the x-axis due to the term. The correct graph will combine these two features.
Not the question you are looking for? Ask here!
Enter question by text
Enter question by image

Unlock Smarter Learning with AskSia Super!
Join Super, our all-in-one AI solution that can greatly improve your learning efficiency.
30% higher accuracy than GPT-4o
Entire learning journey support
The most student-friendly features

Study Other Question