Sia

Question
Statistics
Posted almost 2 years ago
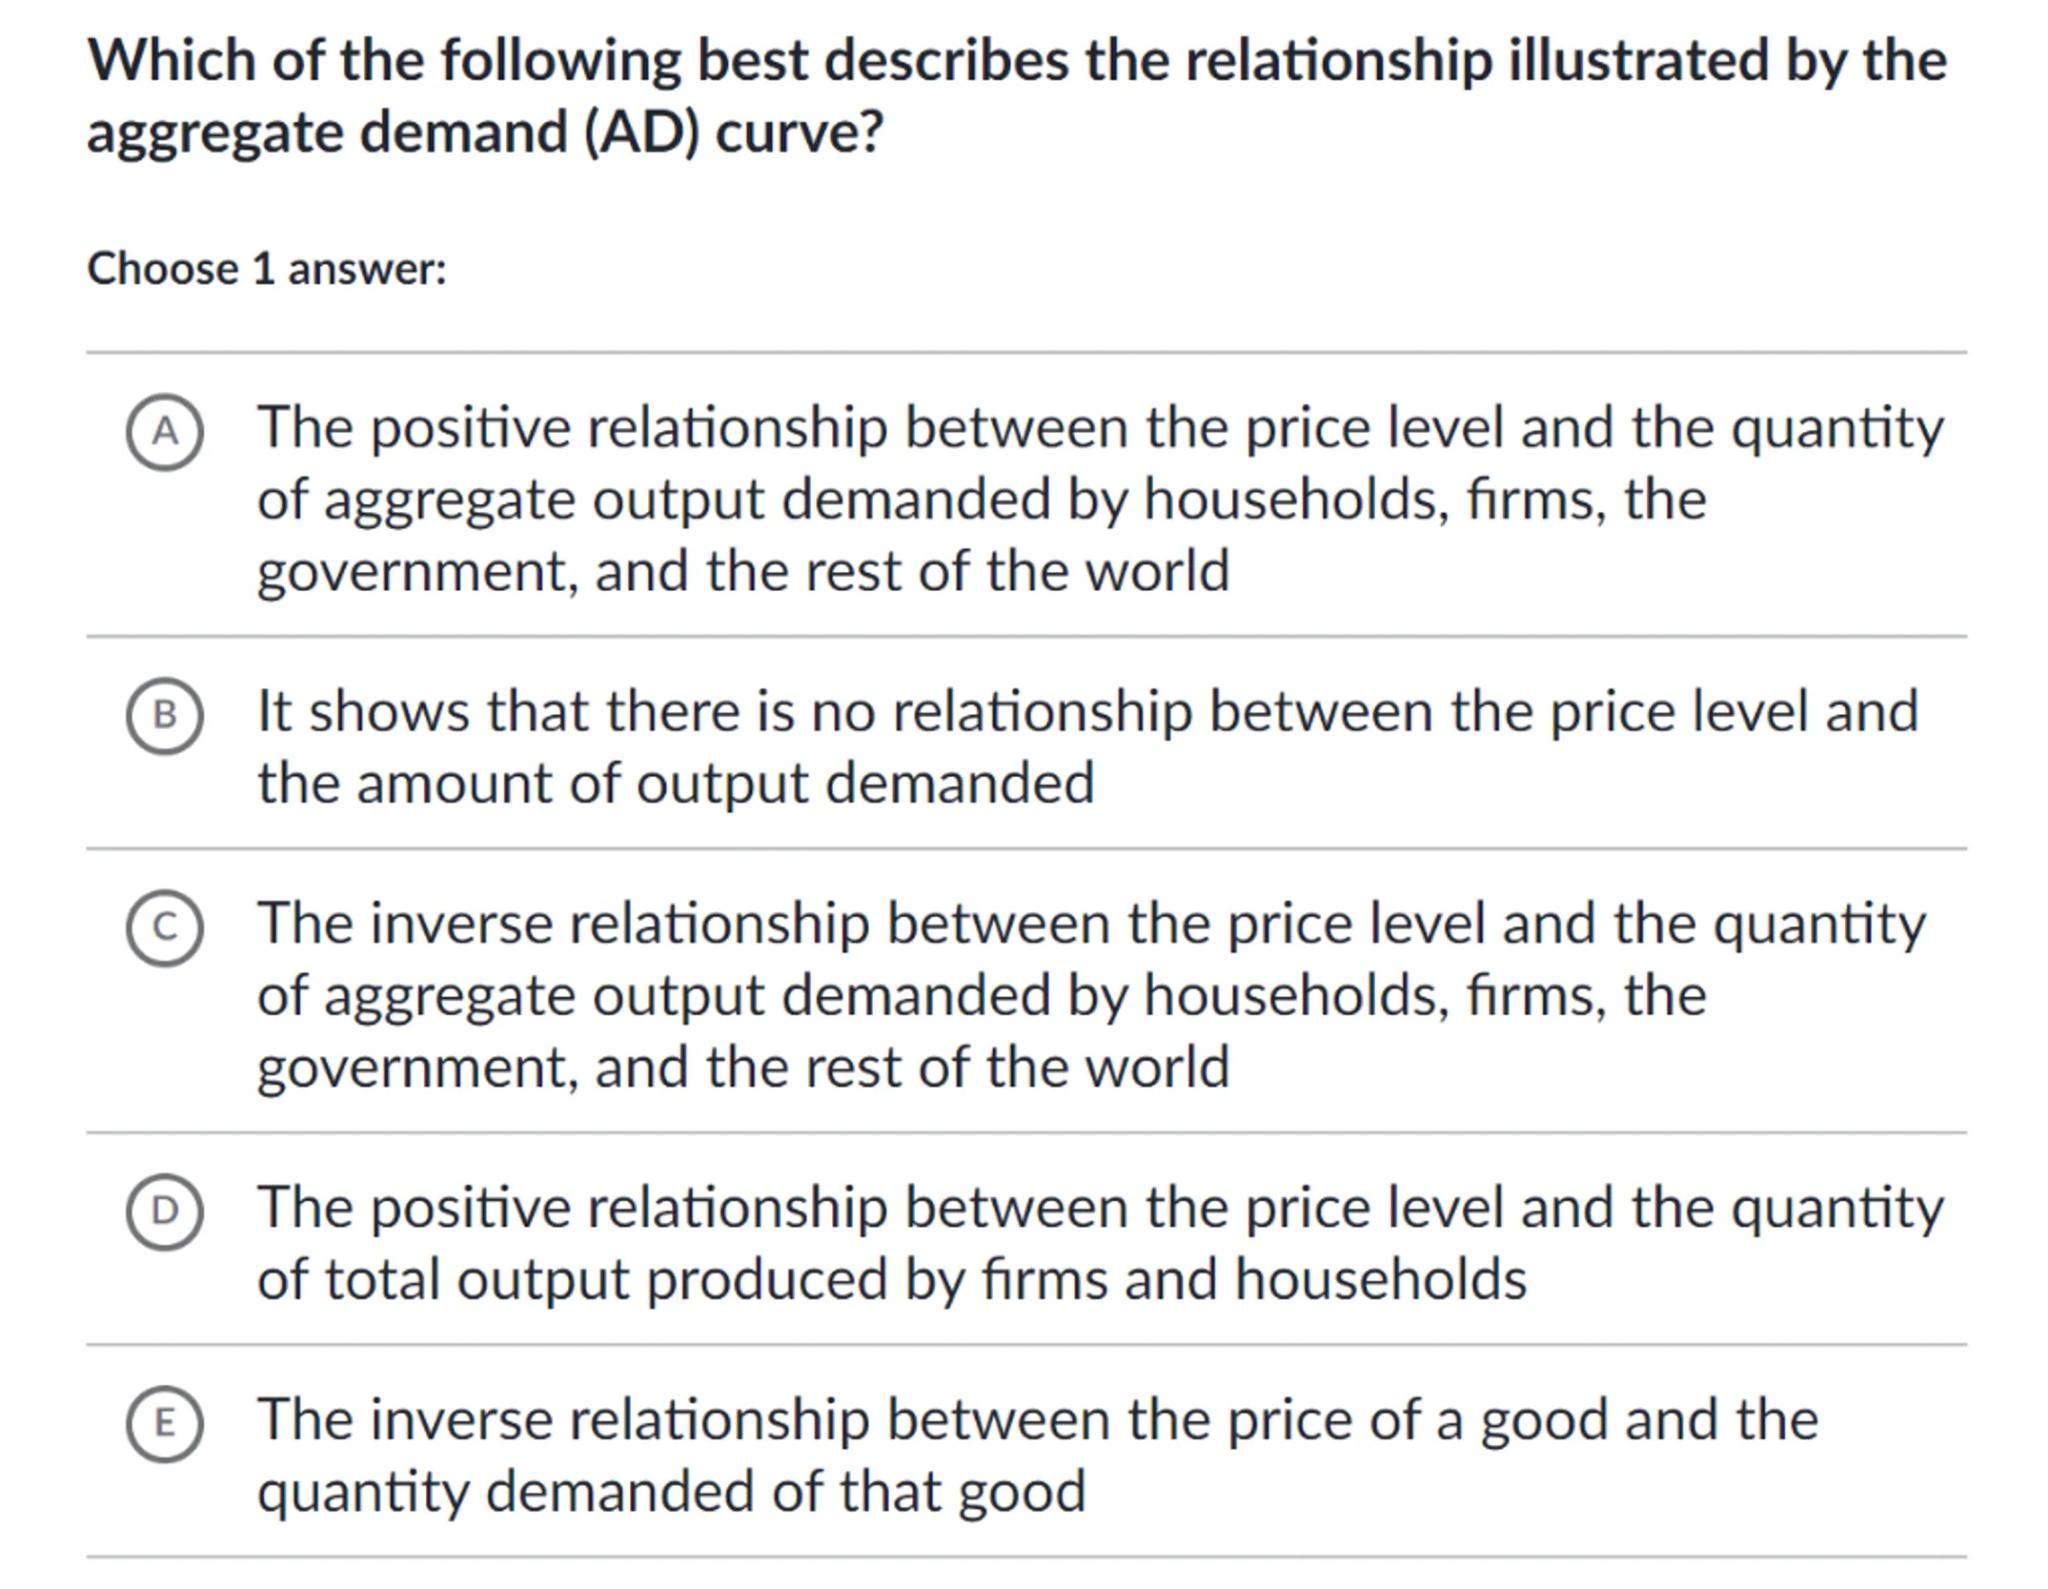
Which of the following best describes the relationship illustrated by the aggregate demand (AD) curve?

Choose 1 answer:

A The positive relationship between the price level and the quantity of aggregate output demanded by households, firms, the government, and the rest of the world

B It shows that there is no relationship between the price level and the amount of output demanded
(c) The inverse relationship between the price level and the quantity of aggregate output demanded by households, firms, the government, and the rest of the world
(D) The positive relationship between the price level and the quantity of total output produced by firms and households
(E) The inverse relationship between the price of a good and the quantity demanded of that good

Answer from Sia
Posted almost 2 years ago
Solution by Steps
step 1
To understand the relationship illustrated by the aggregate demand (AD) curve, we need to recall the basic definition of the AD curve in macroeconomics
step 2
The AD curve represents the total quantity of all goods and services demanded by the economy at different price levels, holding all else constant (ceteris paribus)
step 3
The AD curve typically has a downward slope, indicating an inverse relationship between the price level and the quantity of aggregate output demanded. This is because as the price level decreases, the purchasing power of money increases, leading to an increase in the quantity of goods and services demanded
Answer
C
Key Concept
Inverse Relationship of AD Curve
Explanation
The aggregate demand curve shows the inverse relationship between the price level and the quantity of aggregate output demanded.
Not the question you are looking for? Ask here!
Enter question by text
Enter question by image
Unlock Smarter Learning with AskSia Super!
Join Super, our all-in-one AI solution that can greatly improve your learning efficiency.
30% higher accuracy than GPT-4o
Entire learning journey support
The most student-friendly features
Study Other Question