
AskSia

Question
Microeconomics
Posted about 2 years ago
Which of the following describes the movement indicated by the arrow in the graph shown?
Two supply curves

Choose 1 answer:
(A) A decrease in quantity supplied
(B) A decrease in supply
(c) An increase in the supply
(D) An increase in the quantity supplied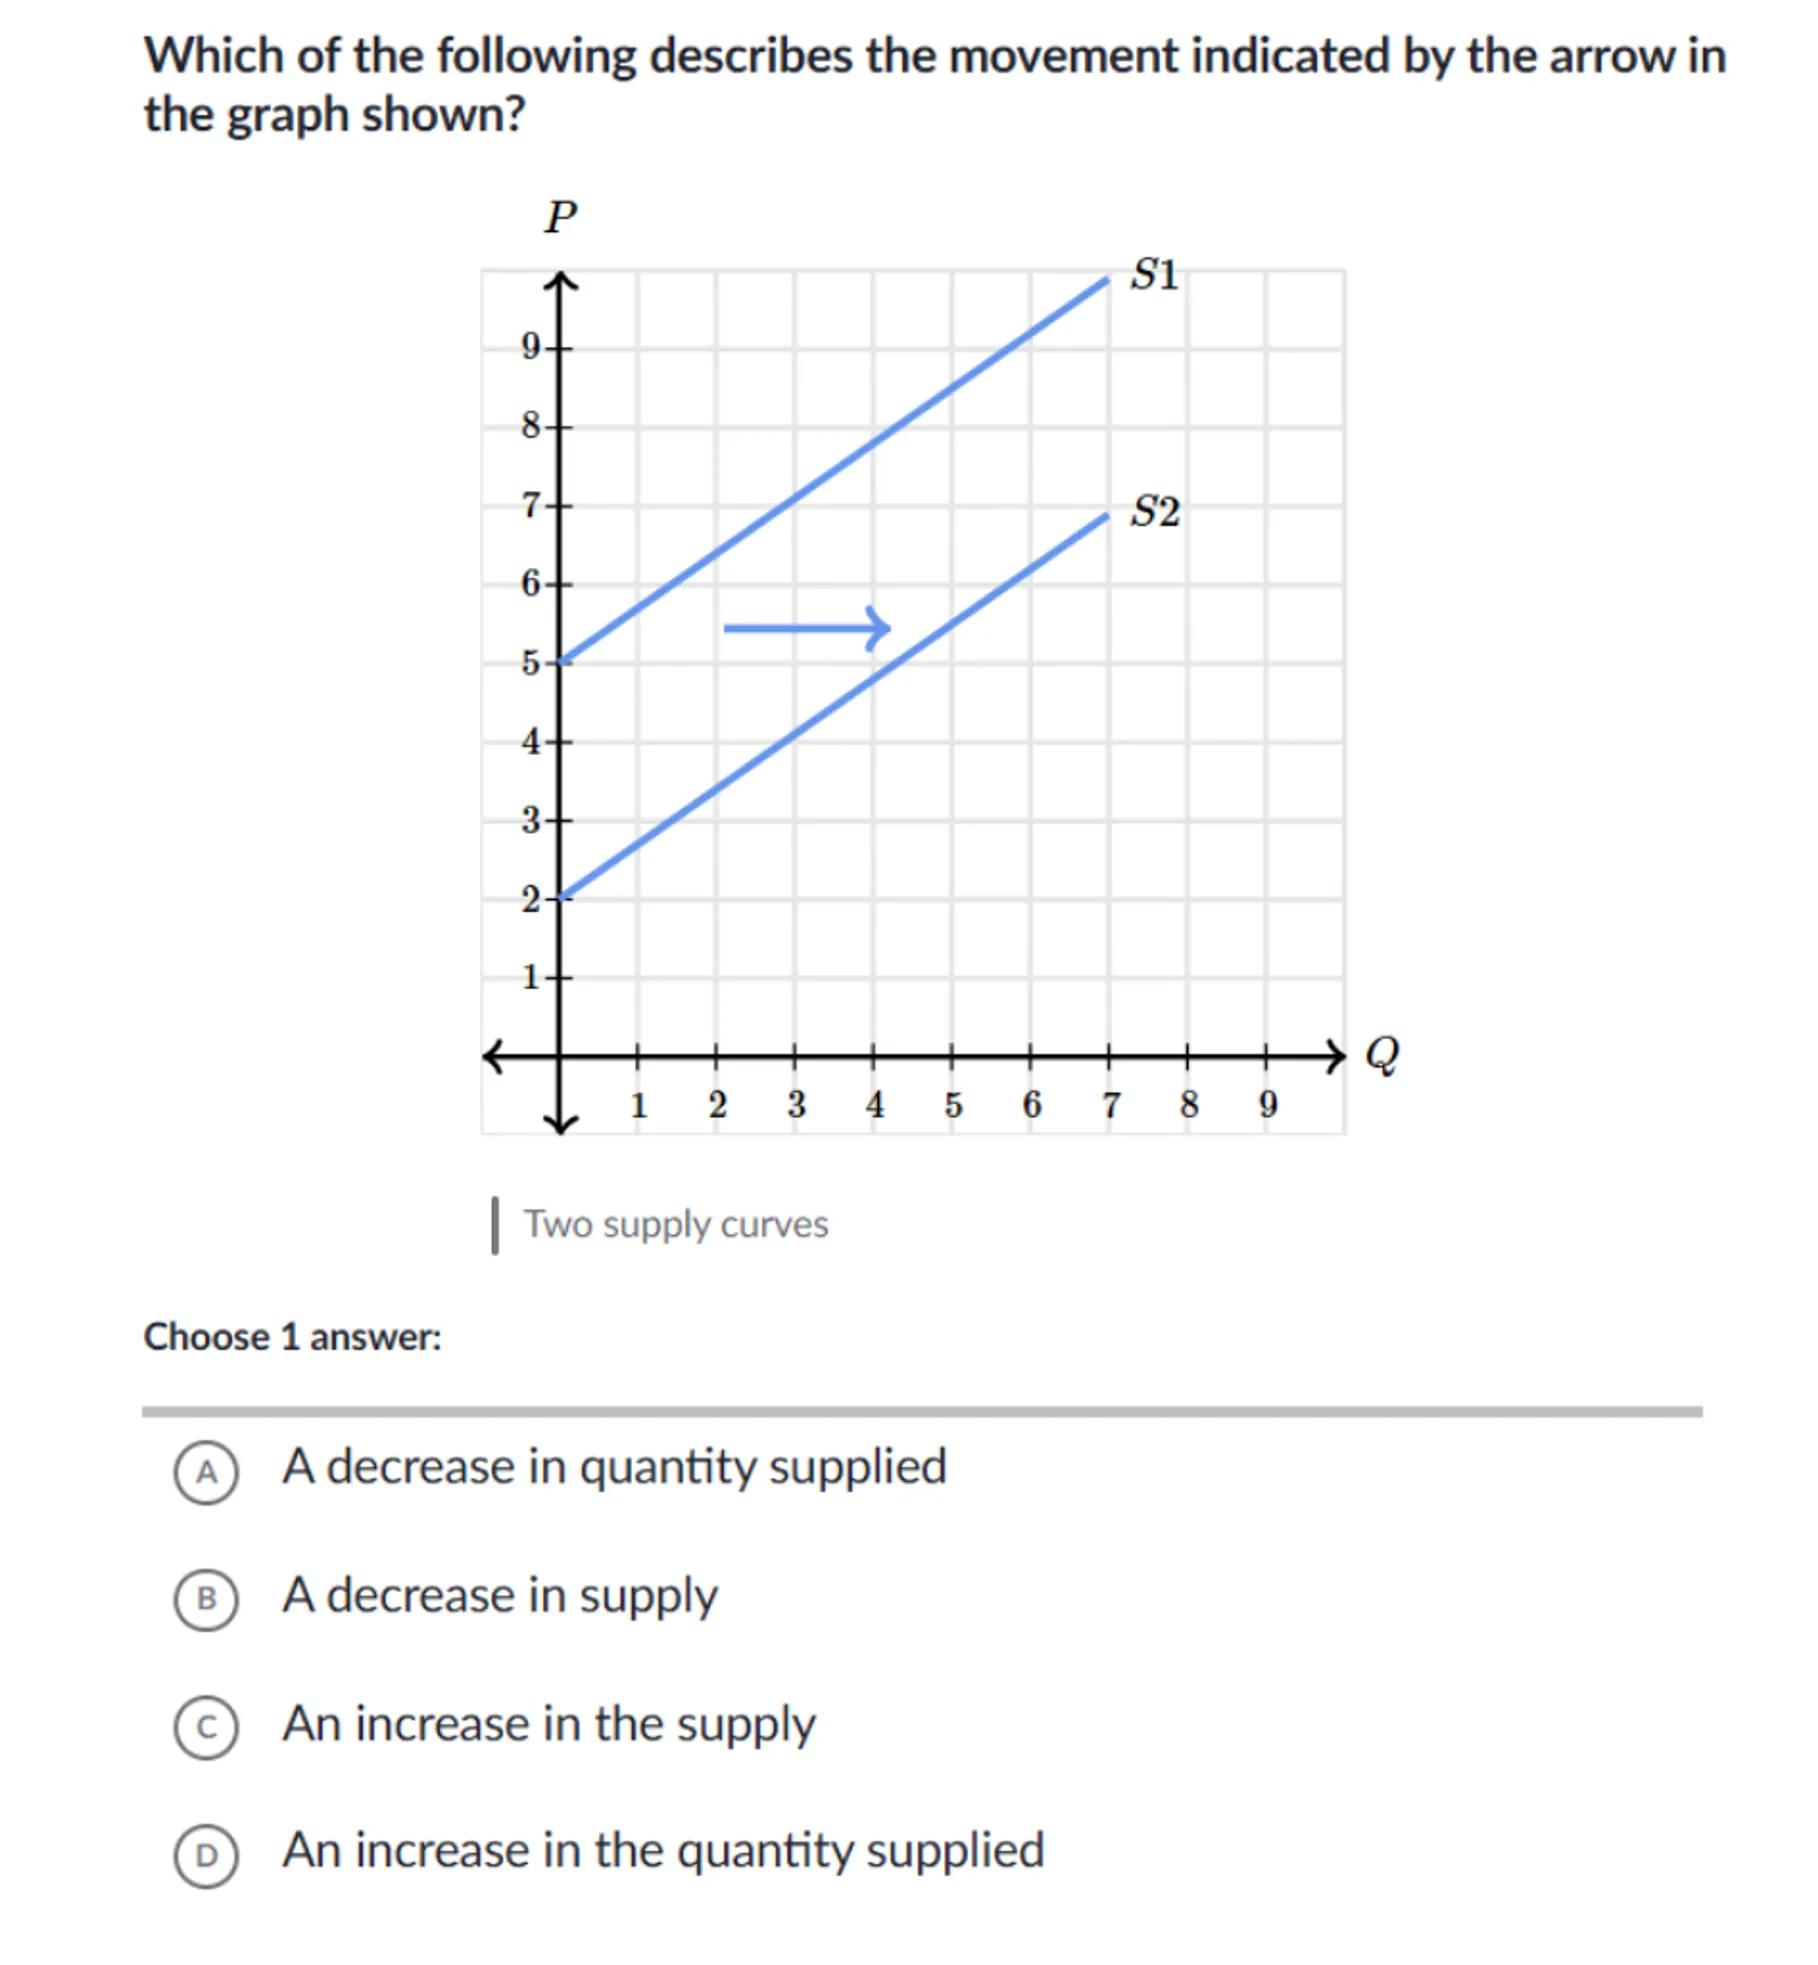
 Sign in to unlock the answer
Answer from Sia
Posted about 2 years ago
Solution
a
Change in Quantity Supplied: A movement along a supply curve, caused by a change in the price of the good
b
Change in Supply: A shift of the entire supply curve, caused by factors other than the price of the good
c
Graph Analysis: The graph shows two supply curves, S1 and S2, with S2 to the right of S1. The rightward arrow indicates a shift from S1 to S2
d
Interpretation: A rightward shift of the supply curve (from S1 to S2) represents an increase in supply
Answer
(C) An increase in the supply
Key Concept
Supply Curve Shift
Explanation
A rightward shift in the supply curve indicates an increase in supply, meaning that at every price level, a greater quantity is supplied.
Not the question you are looking for? Ask here!
Enter question by text
Enter question by image

Unlock Smarter Learning with AskSia Super!
Join Super, our all-in-one AI solution that can greatly improve your learning efficiency.
30% higher accuracy than GPT-4o
Entire learning journey support
The most student-friendly features

Study Other Question