Sia

Question
Microeconomics
Posted over 1 year ago
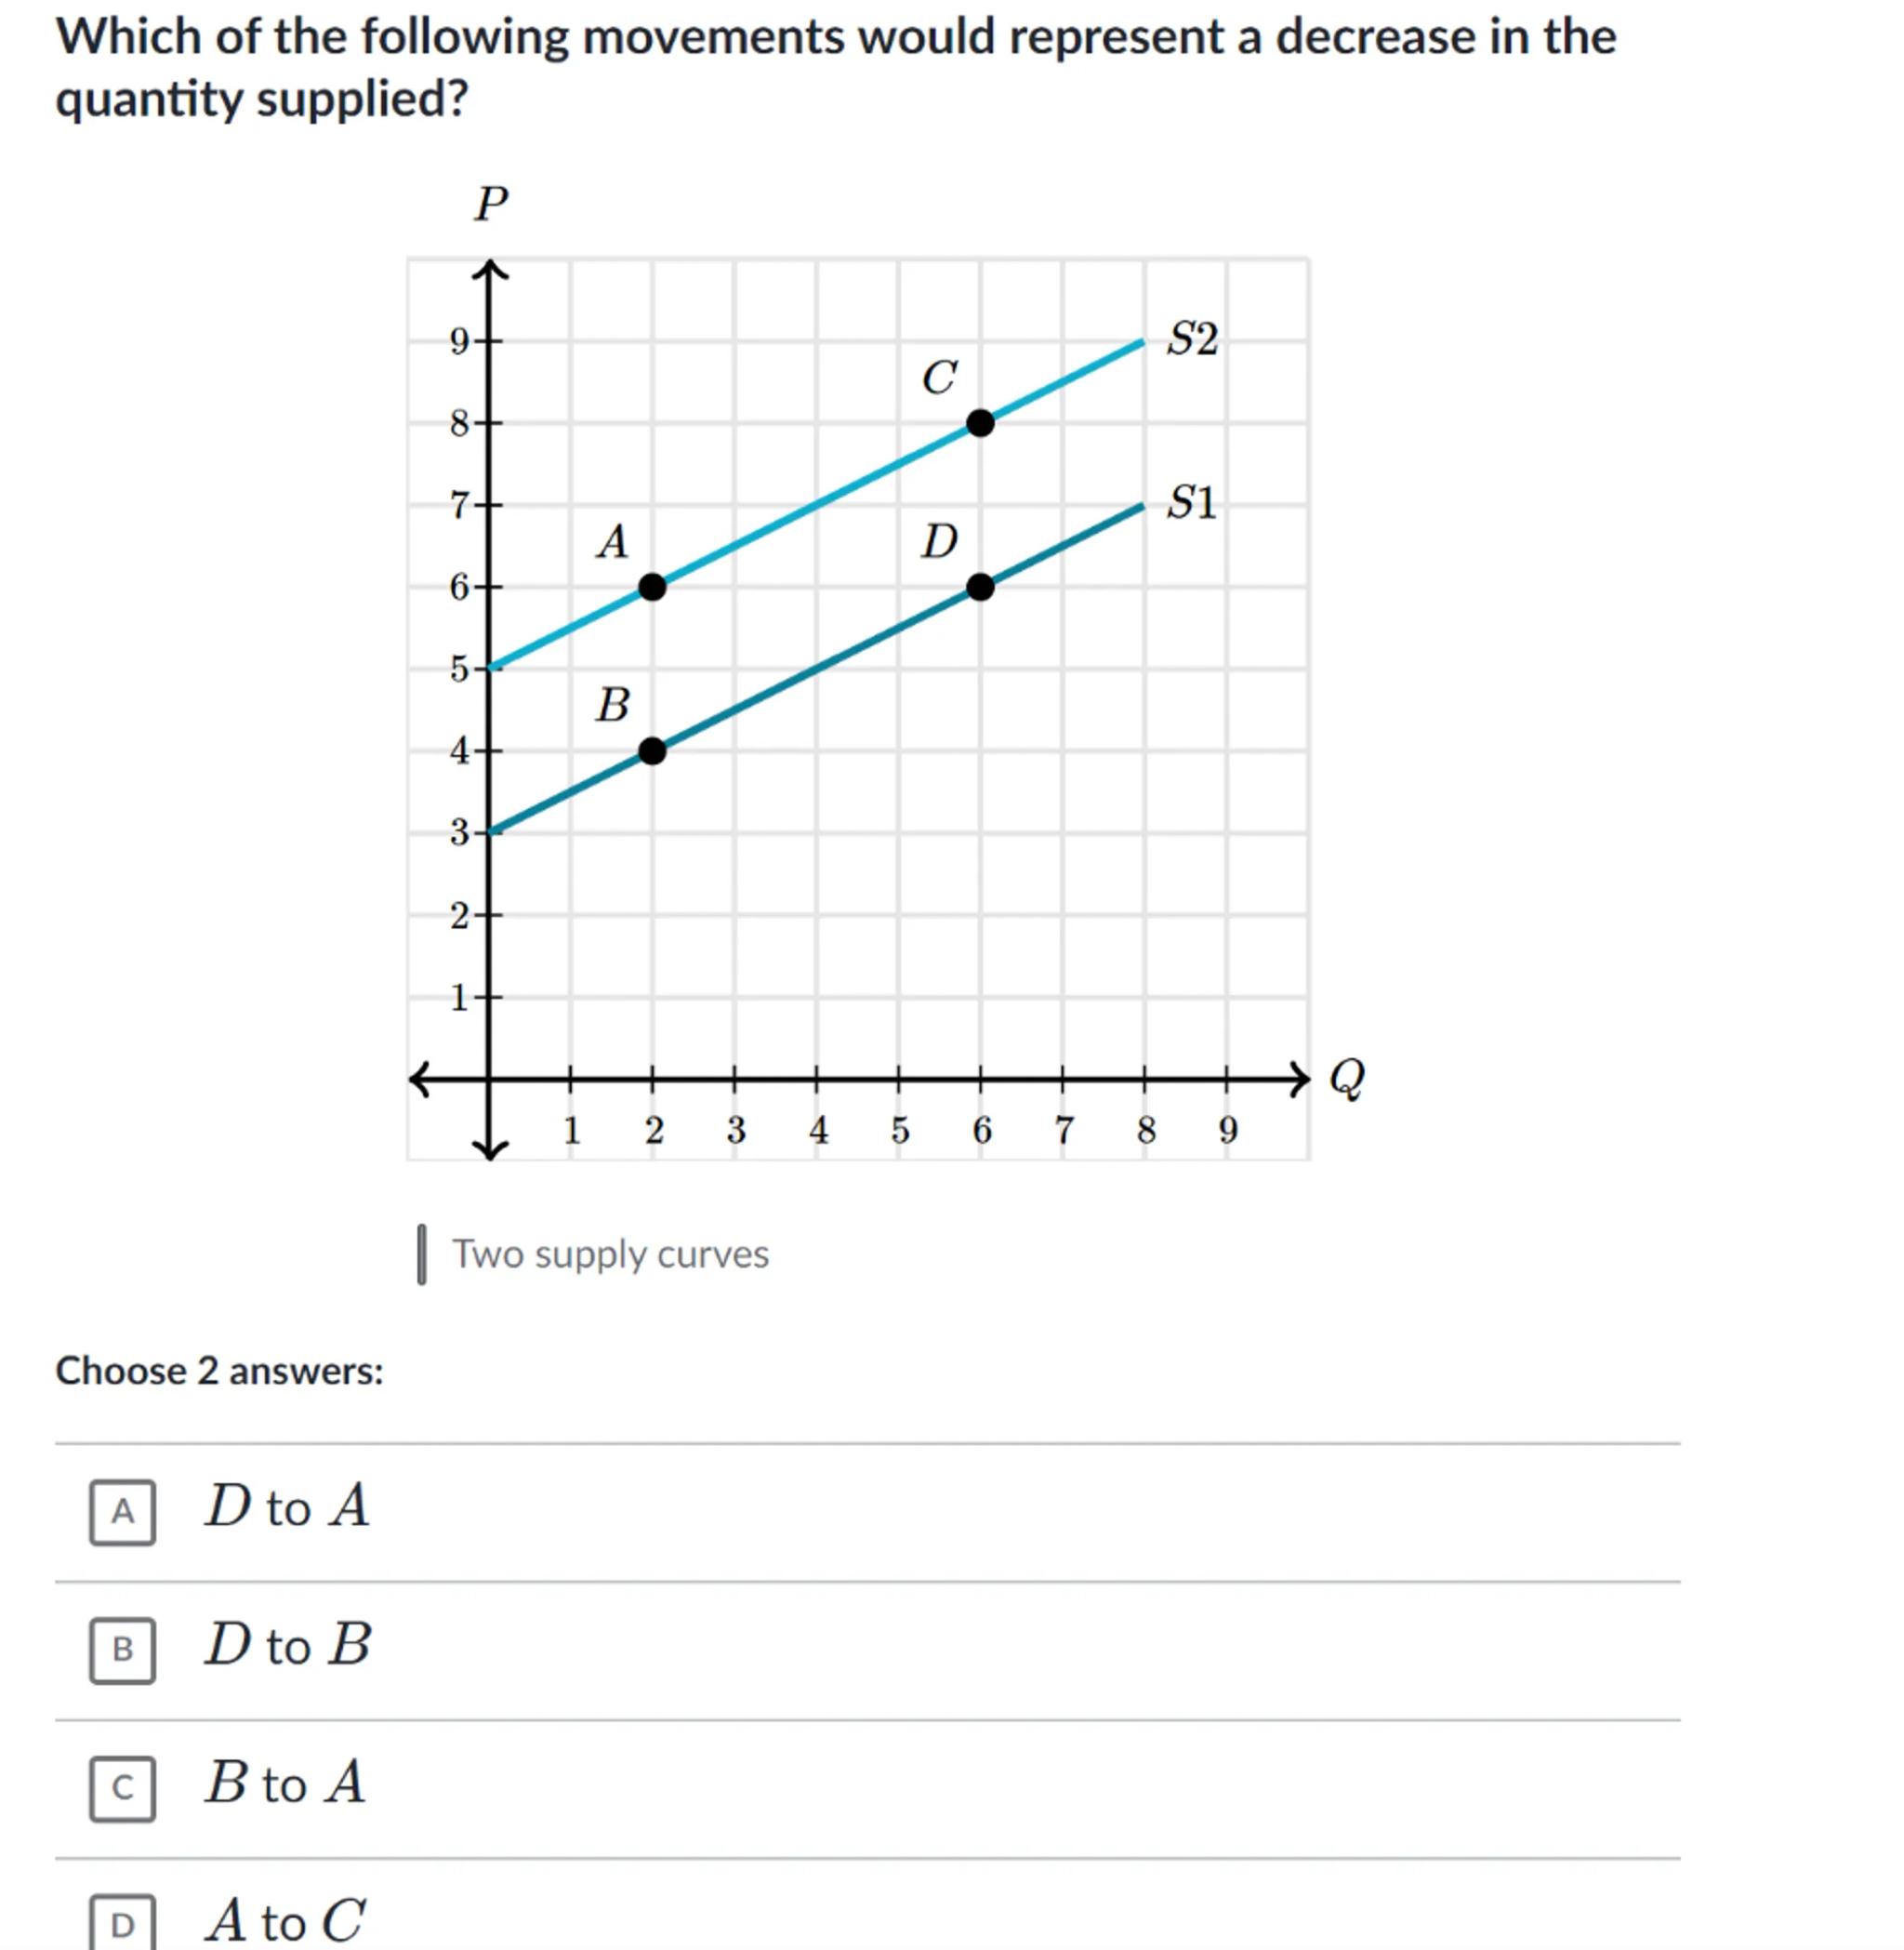
Which of the following movements would represent a decrease in the quantity supplied?
Two supply curves
Choose 2 answers:
A to
B to
c. to
D to 

Answer from Sia
Posted over 1 year ago
Solution
a
Definition of Quantity Supplied: Quantity supplied refers to the amount of a good that producers are willing and able to sell at a given price
b
Movement Along the Supply Curve: A movement along the supply curve occurs when there is a change in the quantity supplied due to a change in the price of the good
c
Decrease in Quantity Supplied: A decrease in the quantity supplied is represented by a movement down the supply curve, which occurs when the price of the good decreases
d
Analysis of Movements:
- From to : This movement is from a higher price () to a lower price (), indicating a decrease in quantity supplied.
- From to : This movement is from a higher price () to a lower price (), indicating a decrease in quantity supplied.
- From to : This movement is from a lower price () to a higher price (), indicating an increase in quantity supplied
Answer
The correct answers are moving from point D to point A and moving from point B to point A.
Key Concept
Decrease in Quantity Supplied
Explanation
A decrease in the quantity supplied is represented by a movement down the supply curve, which occurs when the price of the good decreases. The movements from point D to point A and from point B to point A both represent such a decrease.
Not the question you are looking for? Ask here!
Enter question by text
Enter question by image
Unlock Smarter Learning with AskSia Super!
Join Super, our all-in-one AI solution that can greatly improve your learning efficiency.
30% higher accuracy than GPT-4o
Entire learning journey support
The most student-friendly features
Study Other Question