
AskSia

Question
Macroeconomics
Posted about 2 years ago
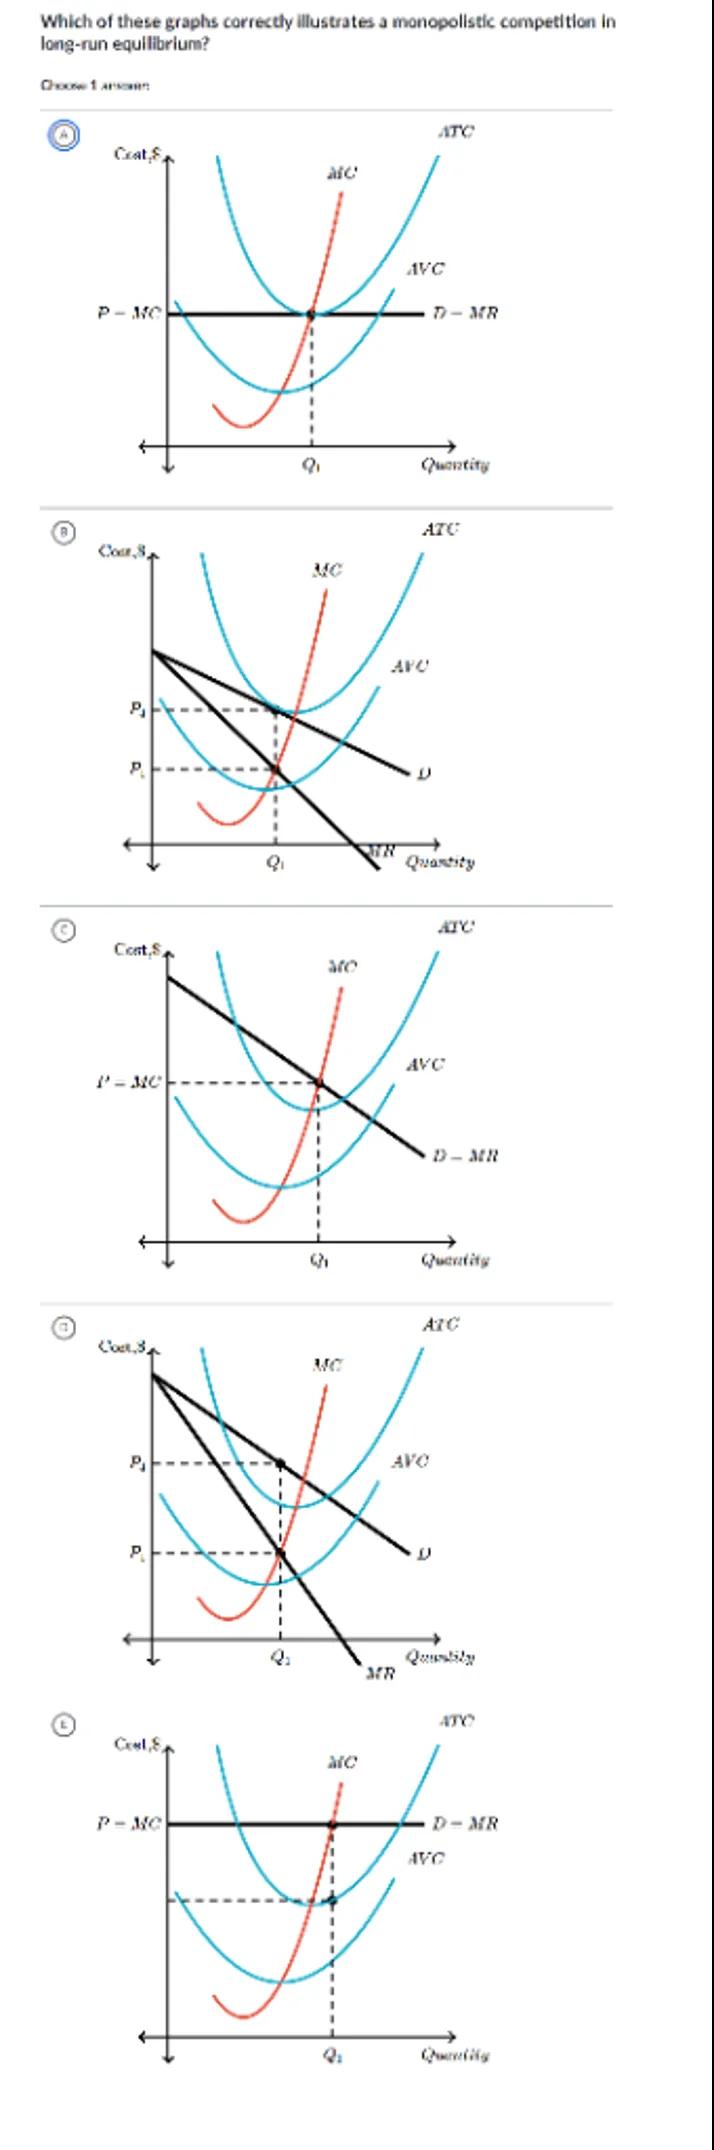
Which of these graphs correctly illustrates a monopolistic competition in long-run equilitbrium?
ount 1rram
(a)
(c)
(5)
 Sign in to unlock the answer
Answer from Sia
Posted about 2 years ago
Solution
a
Identifying Long-Run Equilibrium in Monopolistic Competition: In the long run, a monopolistically competitive firm will produce at a point where the Marginal Cost (MC) curve intersects the Demand (D) curve at the point where the Average Total Cost (ATC) curve is tangent to the Demand (D) curve. This indicates that the firm is making zero economic profit
b
Graph Characteristics for Monopolistic Competition: The correct graph will show the firm's Demand (D) curve as downward sloping and more elastic than that of a monopoly. The Marginal Revenue (MR) curve will also be downward sloping and lie below the Demand (D) curve. The point where MR intersects MC is where the firm will determine its quantity of output. The ATC curve should be tangent to the Demand (D) curve at this quantity, indicating that the firm is breaking even
Answer
The graph that correctly illustrates a monopolistic competition in long-run equilibrium is the one where the ATC curve is tangent to the Demand (D) curve at the point where the MC curve intersects the MR curve.
Key Concept
Long-Run Equilibrium in Monopolistic Competition
Explanation
In the long run, monopolistically competitive firms produce where MC equals MR and ATC is tangent to the Demand curve, indicating zero economic profit.
Not the question you are looking for? Ask here!
Enter question by text
Enter question by image

Unlock Smarter Learning with AskSia Super!
Join Super, our all-in-one AI solution that can greatly improve your learning efficiency.
30% higher accuracy than GPT-4o
Entire learning journey support
The most student-friendly features

Study Other Question