Sia

Question
Macroeconomics
Posted almost 2 years ago
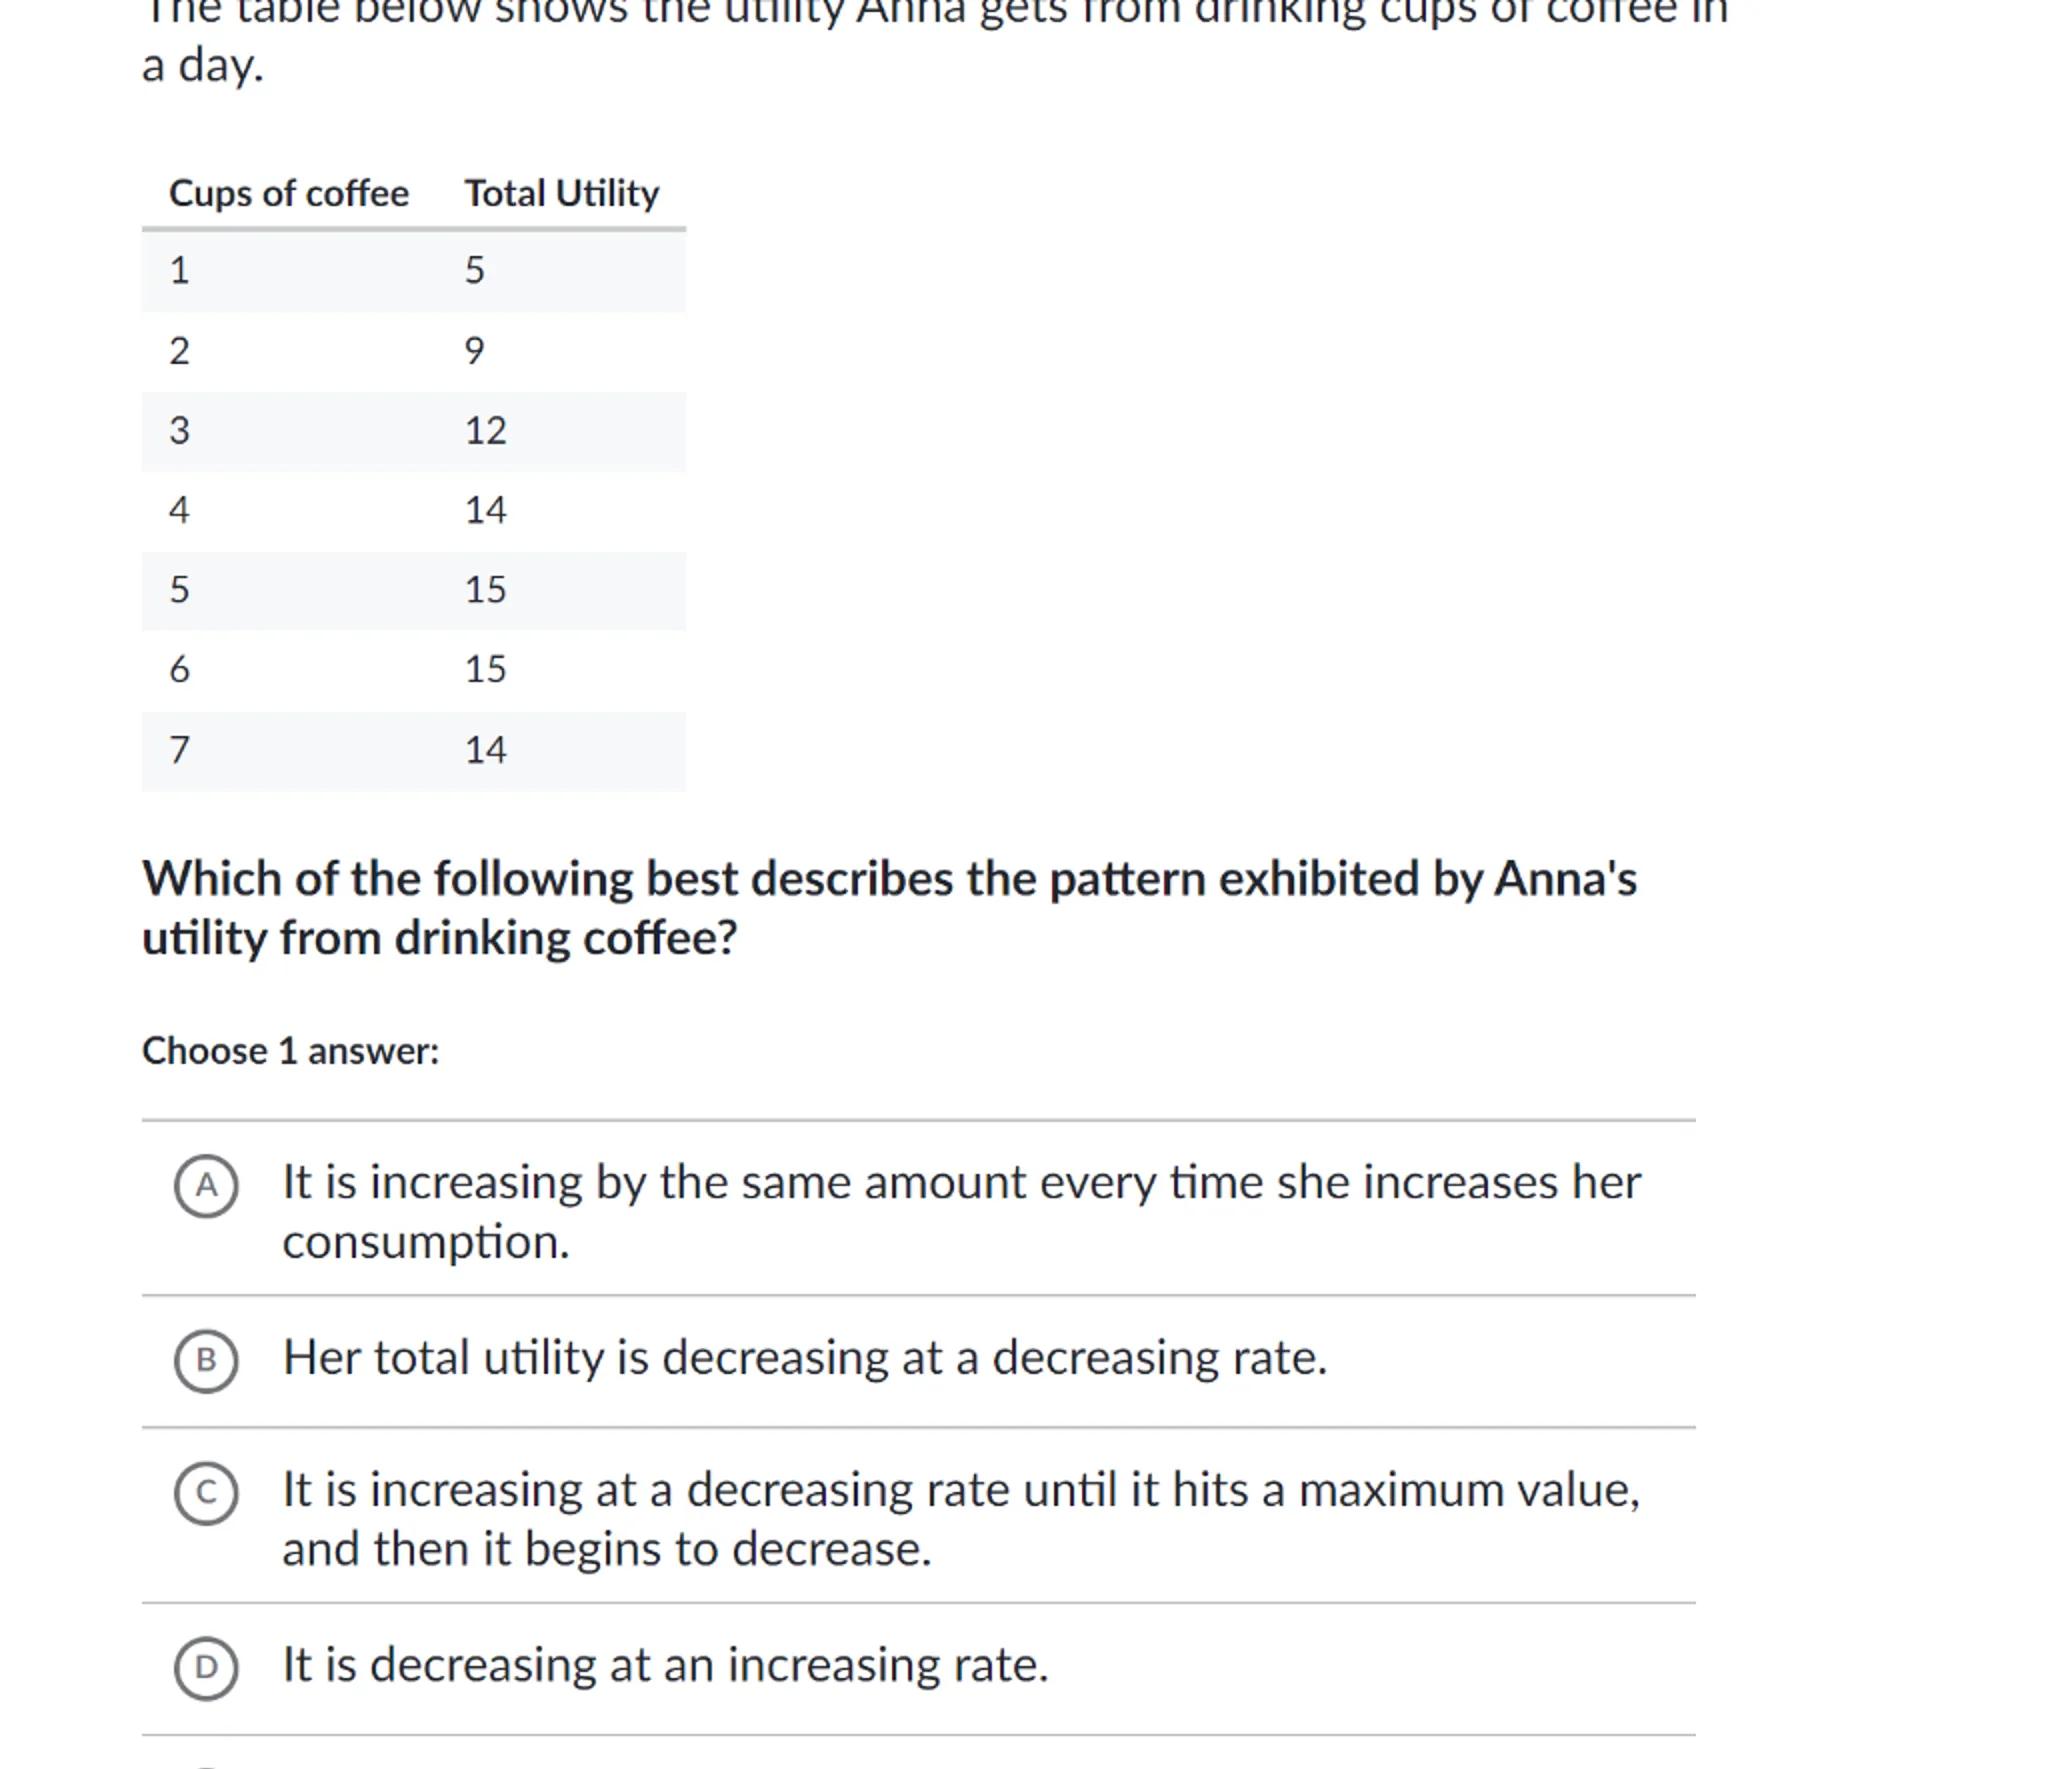
a day.
\begin{tabular}{ll}
Cups of coffee & Total Utility \\
\hline 1 & 5 \\
2 & 9 \\
3 & 12 \\
4 & 14 \\
5 & 15 \\
6 & 15 \\
7 & 14
\end{tabular}

Which of the following best describes the pattern exhibited by Anna's utility from drinking coffee?

Choose 1 answer:

A It is increasing by the same amount every time she increases her consumption.
(B) Her total utility is decreasing at a decreasing rate.
(c) It is increasing at a decreasing rate until it hits a maximum value, and then it begins to decrease.

D It is decreasing at an increasing rate.

Answer from Sia
Posted almost 2 years ago
Solution
a
Analysis of Total Utility Pattern: The table provided shows the total utility Anna derives from consuming cups of coffee. As the number of cups increases, the total utility also increases, but the marginal utility (additional utility gained from consuming one more cup) decreases. After reaching the maximum total utility at 5 cups, the total utility remains the same for 6 cups and then decreases for 7 cups
Answer
(C) It is increasing at a decreasing rate until it hits a maximum value, and then it begins to decrease.
Key Concept
Diminishing Marginal Utility
Explanation
The pattern exhibited by Anna's utility from drinking coffee is an example of diminishing marginal utility, where each additional unit of consumption yields less additional satisfaction until a point is reached where additional consumption leads to a decrease in total utility.
Not the question you are looking for? Ask here!
Enter question by text
Enter question by image
Unlock Smarter Learning with AskSia Super!
Join Super, our all-in-one AI solution that can greatly improve your learning efficiency.
30% higher accuracy than GPT-4o
Entire learning journey support
The most student-friendly features
Study Other Question