
AskSia

Question
Math
Posted about 2 years ago
\begin{tabular}{l|l|l}
Q7: & In a pie graph showing a survey of 180 & A. \\
& people, 100 say "Yes" to tax increases. & B. \\
& What would the angle be at the centre & C. \\
& of the circle for the "Yes" sector? & D.
\end{tabular}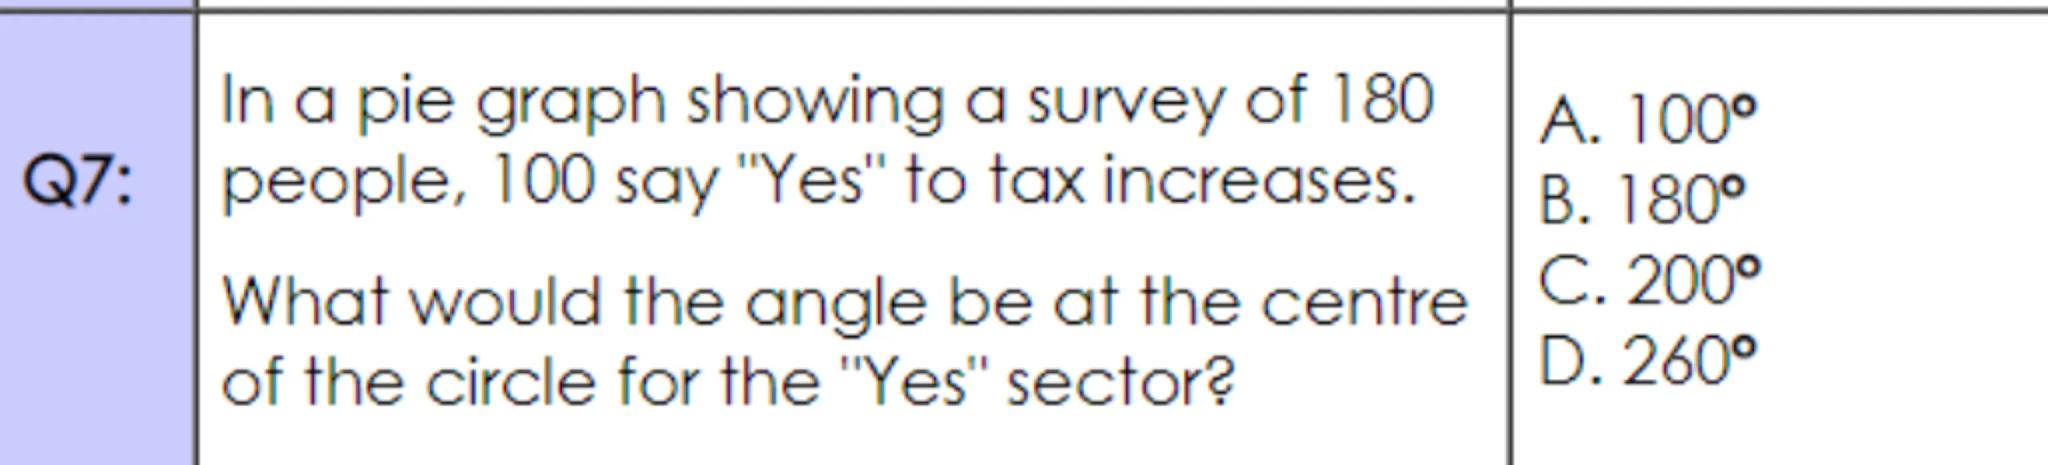
 Sign in to unlock the answer
Answer from Sia
Posted about 2 years ago
Solution by Steps
step 2
Next, we convert this fraction to an angle in degrees. Since a full circle is , we multiply the fraction by :
step 3
Simplifying the multiplication:
C
Key Concept
Fraction to Angle Conversion
Explanation
To find the angle in a pie chart, multiply the fraction of the total represented by the sector by .
Not the question you are looking for? Ask here!
Enter question by text
Enter question by image

Unlock Smarter Learning with AskSia Super!
Join Super, our all-in-one AI solution that can greatly improve your learning efficiency.
30% higher accuracy than GPT-4o
Entire learning journey support
The most student-friendly features

Study Other Question